SHARE Knowledge Hub
Event tree, fault tree and scenario analysis
A fault tree works backward from an unwanted top event to combinations of causes; an event tree works forward from an initiating event through barrier success or failure to outcomes. Use both to test a credible major-accident scenario, but quantify only when failure data, dependencies and assumptions are defensible. Shared utilities, human actions and common-cause failure can make simple probability multiplication misleading.
Understanding Event tree, fault tree and scenario analysis
Event tree analysis (ETA), fault tree analysis (FTA) and scenario analysis are structured ways to understand how unwanted events can begin, develop, be prevented, be detected, be controlled and produce consequences. They support, but do not replace, competent risk assessment, process-hazard analysis, engineering design, operating procedures, emergency planning or legal compliance. A tree is valuable only when it is based on a clear decision, credible process information, transparent assumptions and a route from finding to risk reduction.
Why this matters at work
Consequence labels must describe the harm pathway. Consider thermal radiation, explosion overpressure, fragments, toxic inhalation, oxygen displacement, environmental release, secondary escalation, off-site impact, evacuation, asset damage and recovery time as relevant. Link the outcome to people and receptors, not merely equipment. Where detailed dispersion, explosion or structural modelling is needed, state the model interface, input assumptions, uncertainty and competent reviewer rather than inventing a consequence distance or probability in a general document. Sources: MOD ASEMS event tree analysis; HSE emergency response and spill control.
Analytical failure is usually ordinary rather than dramatic: an old drawing is used; the scope excludes the utility failure that defeats several barriers; a workshop assumes a trip works without reviewing the test record; a change is approved without revisiting the scenario; an operator action is credited despite an alarm flood; a low observed event count is mistaken for proof of control; or the analysis ends when the report is issued. Each failure mode can create a false sense of security because the model still appears complete and professionally presented.
How organisations manage this in practice
Turn each material finding into a specific risk-reduction or evidence action with an owner, priority and verification requirement. Options may include eliminating inventory, reducing a release, removing a common dependency, improving control design, integrity or human interface and revising emergency arrangements. Apply change and readiness controls where implementation alters the system. Close actions through evidence of the actual improvement and update the model and connected barrier information. Review after modification, impairment, incident or new knowledge. A completed workshop or a green action tracker does not itself establish that the critical barriers work today.
Use the connection to expose control imbalance. Some sites devote many resources to response and PPE while leaving weak prevention of loss of containment. Others rely on automatic trips but have little capacity to contain a release after failure. The right mix depends on the scenario, but the hierarchy of control applies: eliminate or reduce the hazard at source, isolate people and inventory, use reliable engineered controls, then organisational and emergency arrangements. A barrier that merely detects an event is not the same as one that prevents it. Sources: MOD ASEMS event tree analysis; MOD ASEMS fault tree analysis.
Before a model informs commissioning, restart, major change, safety-report revision or high-consequence operating decision, verify the analysis against the installed and intended system. This includes document review, field walkdown, line-up check, control-system and alarm review, bypass register, utility configuration, equipment status, procedure review, operator interview and confirmation that the assumed protective functions have been tested and accepted. A pre-start-up safety review should not merely confirm that a tree exists; it should confirm that its critical actions and assumptions are true in the field.
Use one scenario to compare backward and forward reasoning
For an illustrative tank transfer, use “level rises beyond the normal control point” as the initiating event. The event tree follows detection, operator or automatic stopping, then release and consequence controls. The fault tree works backward from “tank overfills” to continued inflow and failure to stop it. This is a qualitative teaching outline, not an approved plant model.
- Work backward from the top event — Ask which combinations of failures can produce the release.
- Work forward from an initiating event — Ask how barrier success or failure changes the outcome.
- Challenge shared dependencies — Check power, logic, maintenance and people before multiplying probabilities.
Two safeguards may each be assigned a failure probability of 0.1 for a classroom calculation. Multiplying to 0.01 requires defensible independence and compatible data. If both lose the same supply, that product omits a common cause. The instrument owner verifies power and tests, operations owns response and impairment limits, and the process engineer resolves the model. Stop at qualitative analysis when evidence cannot support numbers; link each important branch to an owner, test and operating decision.
Content amended 19 October 2026 by the SHARE Knowledge Hub editorial team. This records an editorial content change; the existing technical-review and approval status still applies.
Read backward causes and forward outcomes separately
A fault tree asks how combinations could produce the top event; an event tree follows possible outcomes after an initiating event. A shared power supply can defeat apparently separate branches.
One scenario, two directions of reasoning
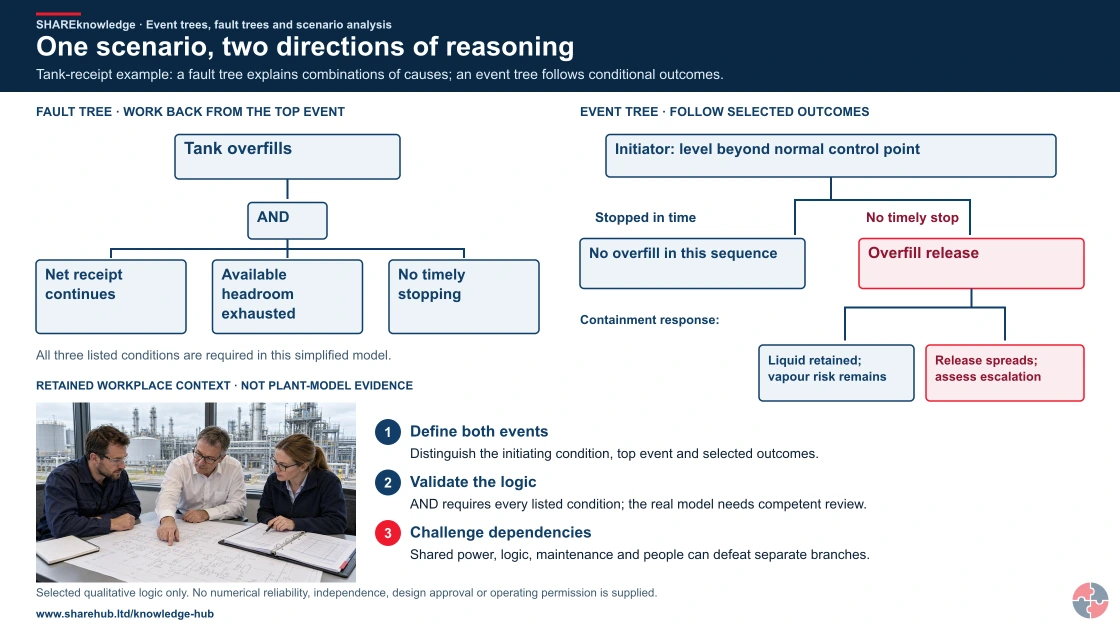
Full written explanation
A qualitative fault tree works backwards from tank overfill through an AND gate to continued net receipt, exhausted available headroom and no timely stopping. All three are required within this deliberately simplified model. Beside it, an event tree starts when level rises beyond its normal control point: timely stopping prevents overfill in that sequence, while no timely stop leads to release and selected liquid-containment outcomes. Retained liquid can still present vapour risk. A small retained plant-review image supplies context only; selected branches, definitions, boundaries and shared dependencies need actual plant evidence.
Tank-receipt example: a fault tree explains combinations of causes; an event tree follows conditional outcomes.
- Define both events. Distinguish the initiating condition, top event and selected outcomes.
- Validate the logic. AND requires every listed condition; the real model needs competent review.
- Challenge dependencies. Shared power, logic, maintenance and people can defeat separate branches.
Change the pathway
- Qualitative boundary. Selected branches are not an exhaustive model or a prediction.
- No automatic independence. A separate drawn branch does not establish separate protection.
- Useful action. Connect important assumptions and barriers to owners and evidence.
Evidence check: Selected qualitative logic only. No numerical reliability, independence, design approval or operating permission is supplied.
Read the initiating event, top event and conditional branches together
Primary references: HSE Corus investigation: fault-tree method example · HSE LPG safety-report assessment: method context, not a current universal design standard
Open the complete HD image (new tab)Download image
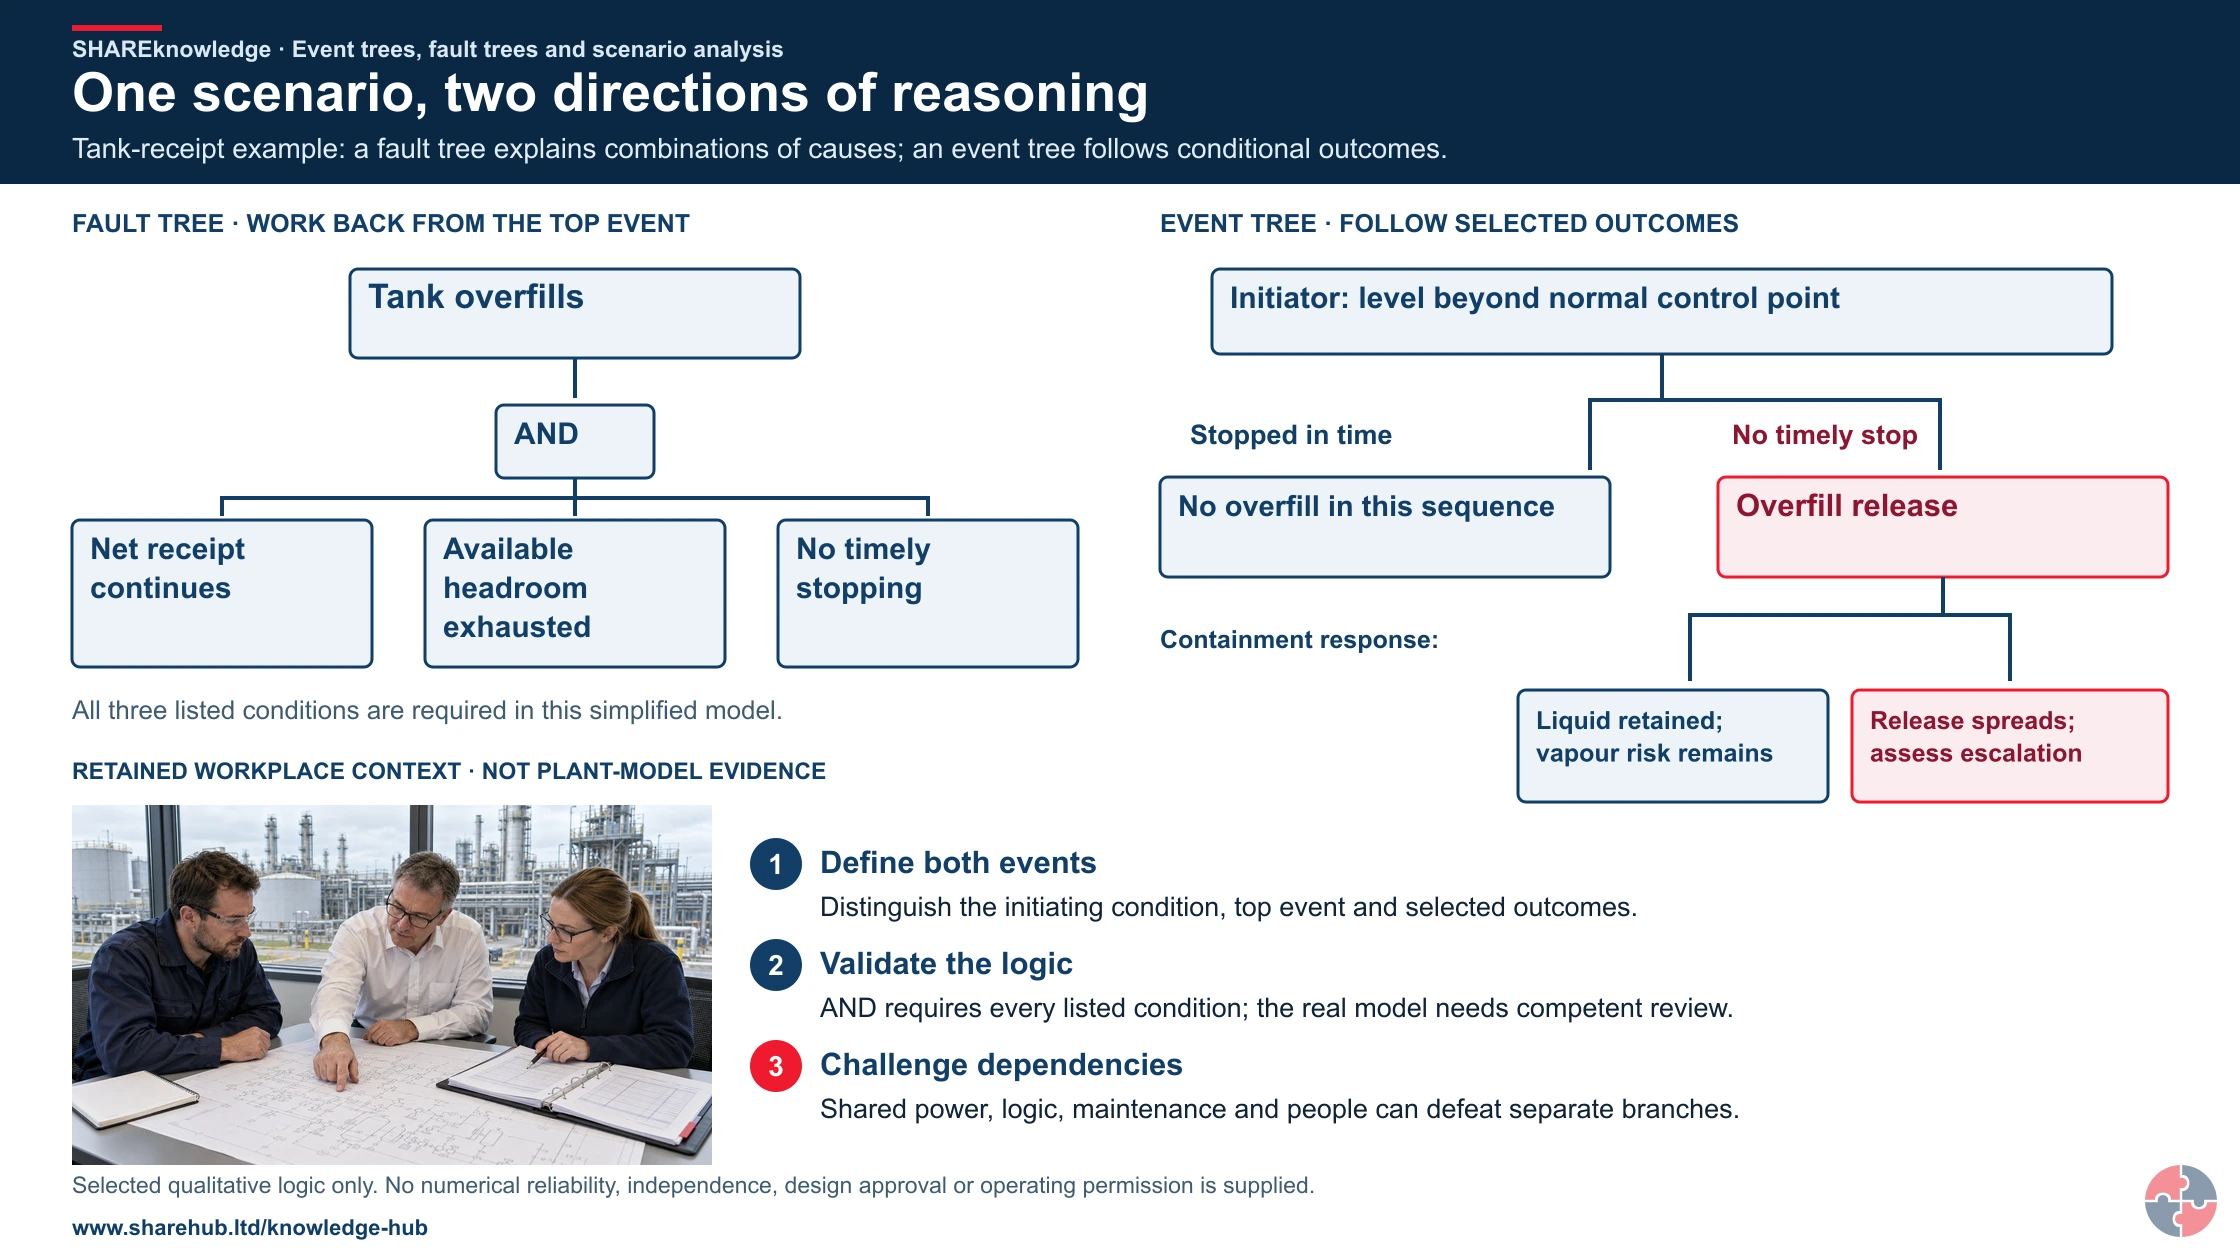
Read the initiating event, top event and conditional branches together
Primary references: HSE Corus investigation: fault-tree method example · HSE LPG safety-report assessment: method context, not a current universal design standard

Fault-tree logic
Use an AND gate only where all input conditions are required and an OR gate where any input can suffice, within the stated model.
Event-tree branches
Define each safeguard’s success/failure meaning and trace the resulting conditional outcomes; do not treat a branch as a complete independent barrier without evidence.
Dependencies and limits
Check common supplies, assumptions, missing causes and evidence quality before calculation. Separate qualitative learning from validated quantitative analysis.
No failure probabilities, independence assumptions or design reliability are invented in this example.
Which question does each analysis answer?
Use a fault tree to ask how a defined top event could occur, then an event tree to ask how an initiating event could develop as barriers succeed or fail. Use scenario analysis to connect the cause, release, escalation, consequence and controls.
Best-practice guide: Event tree, fault tree and scenario analysis
Which question does each analysis answer?
Use a fault tree to ask how a defined top event could occur, then an event tree to ask how an initiating event could develop as barriers succeed or fail. Use scenario analysis to connect the cause, release, escalation, consequence and controls. A fault tree works backward from an unwanted top event to combinations of causes; an event tree works forward from an initiating event through barrier success or failure to outcomes.
Turn event tree, fault tree and scenario analysis knowledge into a decision
A fault tree works backward from an unwanted top event to combinations of causes; an event tree works forward from an initiating event through barrier success or failure to outcomes. Use both to test a credible major-accident scenario, but quantify only when failure data, dependencies and assumptions are defensible. Approved diagrams, assumptions, data provenance, sensitivity and common-cause review, actions and verification records.
A decision that changes work
Build the fault tree for release causes and event tree for detection, shutdown, ignition and mitigation outcomes. Assign stronger prevention and mitigation, verify critical changes and update operating and emergency documents.
Warning signs and responses
Generic scenario wording: Specific escalation paths and barriers are missed. No operator involvement: Work-as-done is absent from the logic. Unsupported probability data: Risk may appear lower than reality.
Choose controls for event tree, fault tree and scenario analysis
Change the work: Use a fault tree to ask how a defined top event could occur, then an event tree to ask how an initiating event could develop as barriers succeed or fail. Strengthen prevention: Use scenario analysis to connect the cause, release, escalation, consequence and controls. Verify the barriers: For a tank overfill, a fault tree tests how level control, instrument and operator failures combine to allow the release. Sustain the controls: An event tree then branches through detection, shutdown, ignition and emergency response. Review the decision: If detector and trip share a power supply, do not treat their failures as independent. Read the full control table for qualifications, ownership and verification. Use the actual task and applicable jurisdiction; existing technical approval remains unchanged.
Use the full event tree, fault tree and scenario analysis lesson
Use the full topic for the decision points, practical examples, detailed control tables and source scope. HSE guidance applies to Great Britain; use HSENI for the Northern Ireland route and the source’s stated jurisdiction. A simplified guide does not change the page’s technical-review or approval status.

Read all six steps as text
1. Which question does each analysis answer?
Use a fault tree to ask how a defined top event could occur, then an event tree to ask how an initiating event could develop as barriers succeed or fail.
- Avoid / redesign: Use a fault tree to ask how a defined top event could occur, then an event tree to ask how an initiating event could develop as barriers succeed or fail.
- Control the task: For a tank overfill, a fault tree tests how level control, instrument and operator failures combine to allow the release.
- Verify before release: Use a fault tree to ask how a defined top event could occur, then an event tree to ask how an initiating event could develop as barriers succeed or fail.
Use a fault tree to ask how a defined top event could occur, then an event tree to ask how an initiating event could develop as barriers succeed or fail. Use scenario analysis to connect the cause, release, escalation, consequence and controls. A fault tree works backward from an unwanted top event to combinations of causes; an event tree works forward from an initiating event through barrier success or failure to outcomes.
Apply it: Which part of this plan would you check at the workface before authorising the task?
2. Turn event tree, fault tree and scenario analysis knowledge into a decision
Use the evidence to improve the actual work arrangement.
- Change at source: Use a fault tree to ask how a defined top event could occur, then an event tree to ask how an initiating event could develop as barriers succeed or fail.
- Make it observable: Use a fault tree to ask how a defined top event could occur, then an event tree to ask how an initiating event could develop as barriers succeed or fail.
- Keep useful evidence: Approved diagrams, assumptions, data provenance, sensitivity and common-cause review, actions and verification records.
A fault tree works backward from an unwanted top event to combinations of causes; an event tree works forward from an initiating event through barrier success or failure to outcomes. Use both to test a credible major-accident scenario, but quantify only when failure data, dependencies and assumptions are defensible. Approved diagrams, assumptions, data provenance, sensitivity and common-cause review, actions and verification records.
Apply it: What evidence would show that the change improves this task, rather than only completing a record?
3. A decision that changes work
Example: a practical application of the existing topic lesson.
- Setting: A flammable-liquid tank overfill and release scenario at a process site.
- Act: Define the initiating event, top event and outcomes; identify independent and shared controls.
- Hold / review: Do not multiply failure probabilities as if independent where barriers share power, software, maintenance or operator action.
Build the fault tree for release causes and event tree for detection, shutdown, ignition and mitigation outcomes. Assign stronger prevention and mitigation, verify critical changes and update operating and emergency documents.
Apply it: At which point would you hold this example, and what evidence would allow it to proceed?
4. Warning signs and responses
Connect the task, the route to the person and the control that can fail.
- Generic scenario wording: Specific escalation paths and barriers are missed.
- No operator involvement: Work-as-done is absent from the logic.
- Unsupported probability data: Risk may appear lower than reality.
Generic scenario wording: Specific escalation paths and barriers are missed. No operator involvement: Work-as-done is absent from the logic. Unsupported probability data: Risk may appear lower than reality.
Apply it: Who could be exposed, including other trades, cleaners, maintainers and people nearby?
5. Choose controls for event tree, fault tree and scenario analysis
Start with the stronger practicable options and verify their effect.
- Change the work: Use a fault tree to ask how a defined top event could occur, then an event tree to ask how an initiating event could develop as barriers succeed or fail.
- Strengthen prevention: Use scenario analysis to connect the cause, release, escalation, consequence and controls.
- Verify the barriers: For a tank overfill, a fault tree tests how level control, instrument and operator failures combine to allow the release.
- Sustain the controls: An event tree then branches through detection, shutdown, ignition and emergency response.
- Review the decision: If detector and trip share a power supply, do not treat their failures as independent.
Change the work: Use a fault tree to ask how a defined top event could occur, then an event tree to ask how an initiating event could develop as barriers succeed or fail. Strengthen prevention: Use scenario analysis to connect the cause, release, escalation, consequence and controls. Verify the barriers: For a tank overfill, a fault tree tests how level control, instrument and operator failures combine to allow the release. Sustain the controls: An event tree then branches through detection, shutdown, ignition and emergency response. Review the decision: If detector and trip share a power supply, do not treat their failures as independent. Read the full control table for qualifications, ownership and verification. Use the actual task and applicable jurisdiction; existing technical approval remains unchanged.
Apply it: Which stronger option can be used here, and who will verify it before accepting the remaining risk?
6. Use the full event tree, fault tree and scenario analysis lesson
Follow the official sources below and retain the task-specific evidence.
- Official guidance: HSE Safety Report Assessment Guide: LPG (method example)
- Official guidance: HSE COMAH 2015 overview
- Task decision: Approved diagrams, assumptions, data provenance, sensitivity and common-cause review, actions and verification records.
Use the full topic for the decision points, practical examples, detailed control tables and source scope. HSE guidance applies to Great Britain; use HSENI for the Northern Ireland route and the source’s stated jurisdiction. A simplified guide does not change the page’s technical-review or approval status.
Apply it: Which official source and full-topic section will you use to resolve the next decision?
| Barrier area | What good looks like | Evidence |
|---|---|---|
| Cause | Identify credible causes rather than vague hazards. | Scenario list. |
| Top event | Define the loss of control, release, ignition, explosion or failed decision point. | Bow-tie or fault tree. |
| Consequence | Describe escalation, harm, business impact and emergency interface. | Consequence analysis. |
| Prevention barriers | Controls that stop the top event occurring. | Barrier register and performance standards. |
| Mitigation barriers | Controls that limit consequences after the top event. | Proof tests, inspections and drill evidence. |
| Impairment controls | Bypasses, degraded safeguards and overdue tests are authorised and temporary controls set. | Impairment log. |
| ALARP record | Risk reduction decisions are documented and periodically reviewed. | ALARP decision record. |
For a tank overfill, a fault tree tests how level control, instrument and operator failures combine to allow the release. An event tree then branches through detection, shutdown, ignition and emergency response. If detector and trip share a power supply, do not treat their failures as independent.
Who needs to understand event tree, fault tree and scenario analysis?
These methods are most important for people who manage high-consequence hazards, complex barriers or process safety assurance.
Who needs to understand event tree, fault tree and scenario analysis? — part 1 of 3


Read the complete visual as text
- These methods are most important for people who manage…: These methods are most important for people who manage high-consequence hazards, complex barriers or process safety assurance.
- Operators and supervisors: Need to understand how a normal task can develop into a serious scenario if barriers fail.
- Engineers and technical authorities: Need to use analysis when defining design safeguards, safety critical elements and performance standards.
Who needs to understand event tree, fault tree and scenario analysis? — part 2 of 3


Read the complete visual as text
- HSSE and process safety advisers: Need to translate scenarios into audits, indicators, procedures and management review evidence.
- Maintenance and inspection teams: Need to understand which tests, inspections and deferrals affect major accident barriers.
Who needs to understand event tree, fault tree and scenario analysis? — part 3 of 3


Read the complete visual as text
- Emergency planners: Need to understand escalation paths, timing, consequences and realistic response limits.
- NEBOSH PSM and Diploma learners: Need to explain the methods and apply them to realistic major accident scenarios.
Operators and supervisors
Need to understand how a normal task can develop into a serious scenario if barriers fail.
Engineers and technical authorities
Need to use analysis when defining design safeguards, safety critical elements and performance standards.
HSSE and process safety advisers
Need to translate scenarios into audits, indicators, procedures and management review evidence.
Maintenance and inspection teams
Need to understand which tests, inspections and deferrals affect major accident barriers.
Emergency planners
Need to understand escalation paths, timing, consequences and realistic response limits.
NEBOSH PSM and Diploma learners
Need to explain the methods and apply them to realistic major accident scenarios.
How can I practise this topic in 3D?

All fuel fire scenarios are treated as the same event
All related inspection points 1 across 1 location
Crown Fuels terminal 1 inspection point
Practice in the SHAREhub environment. Browser practice is separate from workplace competence and formal learning records.
What are the key facts about event tree, fault tree and scenario analysis?
The key facts are that these methods make event sequences visible, test barriers and expose hidden dependence between controls.
Scenario first
Start with a credible loss of containment, fire, explosion, toxic release, overpressure, runaway reaction or confined atmosphere.
Event trees go forward
They show how barrier success or failure after an initiating event changes the outcome.
Fault trees go backward
They show what combinations of failures could produce the top event.
Common cause matters
Several barriers can fail together if they rely on the same people, power, data, maintenance system or management assumption.
Numbers need judgement
Conditional probabilities are useful, but they are only as reliable as the assumptions, data and review behind them.
The output must change decisions
A good analysis leads to better design, testing, operating limits, training, emergency planning and indicators.
What do event trees, fault trees and scenario analysis mean?
They are structured ways of explaining how an unwanted event can happen and how barriers can prevent or limit it.
Scenario analysis is the plain-language story of the event: what starts it, what equipment or human activity is involved, how it develops, which barriers should work and what the consequences may be. It is useful because people can recognise the work, the plant and the decisions. See HSE Safety Report Assessment Guide: LPG (method example).
Event tree analysis takes one initiating event and moves forward through branches. Each branch asks whether a barrier succeeds or fails: detection, trip, isolation, operator response, containment, ignition prevention, fire protection, emergency response and recovery.
Fault tree analysis starts with the top event and moves backwards. It asks what combinations of failures, errors, degradation or external events could produce that outcome. This is useful where several causes must align, or where one hidden weakness could defeat multiple safeguards.
| Term | Plain meaning | Process safety example |
|---|---|---|
| Initiating event | The event that starts the scenario. | Pump seal fails during transfer. |
| Top event | The central unwanted event being analysed. | Loss of containment from pipework or tank. |
| Barrier | A measure that prevents, detects, controls or mitigates the event. | Gas detection, isolation valve, bund or emergency response. |
| Conditional probability | Chance of a later outcome given that an earlier event has happened. | Probability of ignition after vapour release. |
| Escalation path | How the event becomes worse. | Release forms vapour cloud, ignites and affects adjacent plant. |
| Common-cause failure | One cause defeats several controls. | Shared instrument air failure disables multiple valves. |
The linked HSE LPG guide illustrates method and data limitations for one sector. The IEC public catalogue summaries provide the general fault-tree and event-tree method scope; detailed clauses require licensed standards.
How should scenario analysis start?
Scenario analysis should start with the credible major accident event and the real plant, not a generic checklist.
A useful scenario has enough detail to make controls testable. 'Fire' is too vague. 'Overfill of petrol storage tank during receipt, leading to overflow, vapour cloud formation, ignition and escalation to adjacent tanks' is specific enough to identify barriers.
The analysis should define the hazardous inventory, operating mode, initiating event, top event, affected people, environmental pathway, escalation routes, safety critical barriers and emergency-response assumptions. It should also state the operating conditions under which the scenario is credible, such as start-up, shutdown, maintenance, abnormal operation, tanker loading or simultaneous operations.
| Step | Question to answer | Output |
|---|---|---|
| Define the hazard | What material, energy or condition could cause major harm? | Hazardous inventory and operating limits. |
| Define the initiating event | What could start loss of control? | Cause list and trigger conditions. |
| Define the top event | What central event must be prevented? | Loss of containment, overpressure or runaway event. |
| Identify barriers | What prevents, detects, controls or mitigates the event? | Barrier list and ownership. |
| Identify escalation | How could consequences worsen? | Escalation paths and affected systems. |
| Define assurance | What proves each barrier is healthy? | Tests, inspections, drills, indicators and audits. |
How does event tree analysis work?
Event tree analysis works by following the possible success or failure of barriers after an initiating event.
An event tree is useful where the outcome depends on a sequence of barrier responses. For example, after a tank overfill starts, the outcome may depend on high-level detection, independent trip, operator response, overflow containment, vapour dispersion, ignition prevention, fire detection, firefighting and emergency command. See HSE Safety Report Assessment Guide: LPG (method example).
The method helps teams see that the same initiating event can lead to very different outcomes. If detection and isolation work, the event may remain a near miss. If detection fails, containment is weak and ignition occurs, the same initiating event can become a major accident.
| Branch | Question | Decision or evidence |
|---|---|---|
| Detection | Will the abnormal condition be detected in time? | Alarm design, proof testing and alarm response data. |
| Automatic protection | Will the trip, interlock or shutdown work? | Independent protection design and test records. |
| Operator response | Will people recognise and act correctly? | Procedure, training, workload and control-room human factors. |
| Containment | Will secondary containment hold? | Bund design, drainage isolation and inspection records. |
| Ignition control | Will ignition sources be prevented? | DSEAR controls, zoning and equipment suitability. |
| Emergency response | Will consequences be limited? | Drills, incident command, firewater and mutual aid assumptions. |
HSE’s Corus investigation describes fault-tree analysis as a top-down way to combine events leading to a defined unwanted event. Use that official example for the general method; do not assume this summary reproduces a licensed IEC procedure. HSE Corus investigation: fault-tree method (official source).
How does fault tree analysis work?
Fault tree analysis works backwards from a top event to identify combinations of failures that could cause it.
Fault trees are especially useful where the top event needs multiple failures. They help a team avoid the lazy conclusion that one person made one mistake. The tree may show failures in design, maintenance, isolation, labelling, competence, supervision, alarm management and MOC. See HSE Safety Report Assessment Guide: LPG (method example).
A fault tree uses logic gates. An AND gate means several conditions must occur together. An OR gate means any one of several failures could be enough. The method is only useful if the team validates the logic against real plant history, inspection findings and operational experience.
| Component | Meaning | Example |
|---|---|---|
| Top event | The unwanted event being analysed. | Pressure vessel overpressure. |
| Basic event | A root-level failure or cause in the tree. | Relief valve isolated after maintenance. |
| Intermediate event | A combined failure state. | Overpressure protection unavailable. |
| AND gate | All listed causes must occur. | Blocked outlet and failed high-pressure trip. |
| OR gate | Any listed cause can produce the event. | Wrong valve line-up or control valve stuck closed. |
| Cut set | Combination of failures that can produce the top event. | Shared power loss plus no manual response. |
HSE’s Corus investigation describes fault-tree analysis as a top-down way to combine events leading to a defined unwanted event. Use that official example for the general method; do not assume this summary reproduces a licensed IEC procedure. HSE Corus investigation: fault-tree method (official source).
When should event trees, fault trees or bowties be used?
Use the method that best answers the decision question rather than forcing every issue into one diagram.
A fault tree is strongest when the question is 'what could cause this top event?' An event tree is strongest when the question is 'what could happen after this initiating event?' A bowtie is useful for communicating threats, top event, preventive barriers, consequences and mitigative barriers in one visual model.
Many mature process safety programmes use these methods together. A fault tree may identify causes of loss of containment; an event tree may explore escalation after release; a bowtie may summarise barriers for operations and assurance.
| Method | Best for | Limitation |
|---|---|---|
| Scenario analysis | Plain-language event sequence and controls. | Can become vague without defined barriers. |
| Fault tree | Understanding combinations of causes for a top event. | Can become complex and falsely precise. |
| Event tree | Understanding possible outcomes after an initiating event. | Needs realistic barrier-success assumptions. |
| Bowtie | Communicating threats, barriers and consequences. | May hide detailed probability logic. |
| HAZOP | Systematic process deviation study. | Does not by itself show full escalation sequence. |
| LOPA | Semi-quantitative protection layer adequacy. | Depends on valid independence and probability assumptions. |
How should conditional probabilities be used without false precision?
Conditional probabilities should be used to support judgement, not to disguise weak assumptions as certainty.
Numbers can help compare scenarios and test whether additional protection is needed. They can also mislead if the team uses generic data without understanding local design, maintenance quality, competence, operating mode, demand rate or common-cause vulnerability. See HSE Safety Report Assessment Guide: LPG (method example).
For example, an independent high-high level trip may have a published reliability claim, but that claim is not helpful if the trip is poorly proof-tested, bypassed during maintenance, shares a level instrument with the alarm or is not independent of the basic control system.
| Check | Why it matters | Evidence |
|---|---|---|
| Independence | A barrier is less valuable if it fails with another barrier. | Design review and cause-and-effect testing. |
| Demand rate | A low failure probability may still matter if the demand is frequent. | Operating history and alarm/demand logs. |
| Proof testing | Reliability assumptions depend on testing quality. | Test procedure, interval and defect history. |
| Human response | People need time, information and authority to act. | Human factors review and drill evidence. |
| Data source | Generic data may not match local conditions. | Justification note and sensitivity check. |
| Uncertainty | Uncertain assumptions should be visible. | Assumption log and review trigger. |
Why is common-cause failure so important?
Common-cause failure is important because one weakness can defeat several barriers that look independent on paper.
Major accidents often involve barriers that appear separate but are not truly independent. They may share the same power supply, instrument tapping, maintenance team, calibration procedure, human decision, software logic, emergency access route, drainage system or organisational priority.
This is why a barrier register should not only list controls. It should test dependence. If two controls rely on the same person noticing the same alarm during a high workload period, they may not be two independent barriers.
| Common cause | Barriers affected | Control |
|---|---|---|
| Shared instrument | Alarm and trip both depend on same level device. | Independent measurement and proof testing. |
| Shared power | Detection, shutdown and ventilation fail together. | Backup power and fail-safe design. |
| Poor maintenance system | Multiple safety critical items overdue. | Backlog escalation and leadership review. |
| Bypass culture | Trips and alarms inhibited during production pressure. | Bypass control, authorisation and compensating measures. |
| Weak training | Procedures, emergency response and handover fail together. | Competence assessment and realistic drills. |
| Bad MOC | Design, procedure and training all lag behind change. | MOC and pre-start-up safety review. |
How should analysis improve barrier management?
Analysis should improve barrier management by turning diagrams into owned, tested and reviewed controls.
Barrier management outputs — part 1 of 2


Read the complete visual as text
- Barrier register: What it should define: Safety critical barriers linked to scenarios. Evidence: Register, owner and performance standard.
- Inspection plan: What it should define: Which physical barriers are checked and how often. Evidence: Inspection records and defects closed.
- Proof-test plan: What it should define: Which trips, alarms and interlocks are tested. Evidence: Test records, failures and overdue list.
Barrier management outputs — part 2 of 2


Read the complete visual as text
- Procedure controls: What it should define: Which human tasks are safety critical. Evidence: Task analysis, training and observation.
- Emergency assumptions: What it should define: What response is needed and by when. Evidence: Drills, exercise learning and command structure.
- PSM indicators: What it should define: Leading and lagging signals linked to barriers. Evidence: Dashboard and leadership review minutes.
A diagram that sits in a report but does not change maintenance, training, inspection, operating limits or emergency planning has limited value. Every significant barrier should have an owner, performance standard, test or inspection method, impairment rule and escalation route.
This is where HSG254-style thinking matters. Indicators should not count generic activity only. They should tell leaders whether the barriers identified in the scenario analysis are healthy today.
| Output | What it should define | Evidence |
|---|---|---|
| Barrier register | Safety critical barriers linked to scenarios. | Register, owner and performance standard. |
| Inspection plan | Which physical barriers are checked and how often. | Inspection records and defects closed. |
| Proof-test plan | Which trips, alarms and interlocks are tested. | Test records, failures and overdue list. |
| Procedure controls | Which human tasks are safety critical. | Task analysis, training and observation. |
| Emergency assumptions | What response is needed and by when. | Drills, exercise learning and command structure. |
| PSM indicators | Leading and lagging signals linked to barriers. | Dashboard and leadership review minutes. |
What is a practical workflow for carrying out the analysis?
A practical workflow starts with scope, builds the scenario logic, tests assumptions, records actions and keeps the analysis alive.
Analysis workflow — part 1 of 2


Read the complete visual as text
- Scope: What to do: Define system, operating mode and scenario boundary. Good output: Terms of reference and assumptions.
- Gather information: What to do: Use process data, drawings, incident history and inspection findings. Good output: Evidence pack and gap list.
- Build logic: What to do: Create scenario, event tree or fault tree. Good output: Reviewed diagram and cause list.
- Challenge: What to do: Test independence, common cause and human response assumptions. Good output: Challenge log and sensitivity notes.
Analysis workflow — part 2 of 2


Read the complete visual as text
- Improve controls: What to do: Agree design, maintenance, procedure, training or emergency actions. Good output: Action plan with owners.
- Integrate: What to do: Link outputs into risk register, MOC, indicators and audits. Good output: Updated management-system records.
- Review: What to do: Revisit after incidents, change, audit findings or barrier degradation. Good output: Review record and revised analysis.
Illustrative seven-step decision route — part 1 of 2


Read the complete visual as text
- Define: Action: Name the initiating event, top event and consequence. Check: Team checks the boundary on a current P&ID. Failure mode: A vague event makes branches incomparable. Hold point: Hold analysis without a fixed scenario.
- Trace causes: Action: Build a fault tree for failure combinations. Check: Engineer checks AND/OR gates against plant design. Failure mode: Missing common utilities create false independence. Hold point: Rework tree when a shared cause is found.
- Branch outcomes: Action: Build an event tree from the initiating event. Check: Operators test success/failure paths at abnormal states. Failure mode: A branch may assume impossible operator response. Hold point: Hold a branch without credible timing.
- Check data: Action: Use relevant failure data and uncertainty ranges. Check: Analyst records provenance and exposure time. Failure mode: Generic rates may not fit the site. Hold point: Do not publish a precise frequency without support.
Illustrative seven-step decision route — part 2 of 2


Read the complete visual as text
- Check dependency: Action: Identify common cause and mutually dependent barriers. Check: Technical authority reviews shared power and human actions. Failure mode: Multiplication understates risk when barriers correlate. Hold point: Remove unsupported independence assumption.
- Act: Action: Prioritise stronger prevention and mitigation. Check: Owner specifies physical change and performance test. Failure mode: A new procedure alone may be weak. Hold point: No operation with known critical barrier gap.
- Review: Action: Update after change, test, near miss or incident. Check: Assurance lead compares model with current barrier status. Failure mode: A static model becomes obsolete. Hold point: Reopen decision when plant basis changes.
The team should include people who understand the plant, the operation, maintenance, instrumentation, human factors, emergency response and the hazard. The facilitator should stop the workshop becoming a paperwork exercise and keep asking what could really happen on site.
The final output should be version-controlled and linked to the risk register, bowties, operating procedures, maintenance strategy, MOC, emergency plan and PSM indicators.
| Stage | What to do | Good output |
|---|---|---|
| Scope | Define system, operating mode and scenario boundary. | Terms of reference and assumptions. |
| Gather information | Use process data, drawings, incident history and inspection findings. | Evidence pack and gap list. |
| Build logic | Create scenario, event tree or fault tree. | Reviewed diagram and cause list. |
| Challenge | Test independence, common cause and human response assumptions. | Challenge log and sensitivity notes. |
| Improve controls | Agree design, maintenance, procedure, training or emergency actions. | Action plan with owners. |
| Integrate | Link outputs into risk register, MOC, indicators and audits. | Updated management-system records. |
| Review | Revisit after incidents, change, audit findings or barrier degradation. | Review record and revised analysis. |
Illustrative seven-step decision route; this is a SHARE teaching example, not a prescribed legal checklist.
| Step | Action | Check | Failure mode | Hold point |
|---|---|---|---|---|
| Define | Name the initiating event, top event and consequence. | Team checks the boundary on a current P&ID. | A vague event makes branches incomparable. | Hold analysis without a fixed scenario. |
| Trace causes | Build a fault tree for failure combinations. | Engineer checks AND/OR gates against plant design. | Missing common utilities create false independence. | Rework tree when a shared cause is found. |
| Branch outcomes | Build an event tree from the initiating event. | Operators test success/failure paths at abnormal states. | A branch may assume impossible operator response. | Hold a branch without credible timing. |
| Check data | Use relevant failure data and uncertainty ranges. | Analyst records provenance and exposure time. | Generic rates may not fit the site. | Do not publish a precise frequency without support. |
| Check dependency | Identify common cause and mutually dependent barriers. | Technical authority reviews shared power and human actions. | Multiplication understates risk when barriers correlate. | Remove unsupported independence assumption. |
| Act | Prioritise stronger prevention and mitigation. | Owner specifies physical change and performance test. | A new procedure alone may be weak. | No operation with known critical barrier gap. |
| Review | Update after change, test, near miss or incident. | Assurance lead compares model with current barrier status. | A static model becomes obsolete. | Reopen decision when plant basis changes. |
What makes event tree and fault tree analysis reliable?
Reliable analysis is specific, evidence-based, reviewed, current and connected to real controls.
Poor analysis often looks impressive but adds little value. It may use generic scenarios, unsupported probabilities, outdated drawings, missing operator input, no maintenance history, no common-cause review and no action tracking.
A high-quality analysis can be challenged by an operator, engineer or regulator and still make sense. It should explain assumptions clearly enough that a future reviewer can see why the team made its decisions.
| Quality check | Weak output | Strong output |
|---|---|---|
| Specificity | Generic fire or explosion scenario. | Named plant, material, operating mode and escalation path. |
| Evidence | Workshop opinion only. | Drawings, incident history, inspection records and operating data. |
| Barrier clarity | Controls listed without owners. | Owned barriers with performance standards. |
| Human factors | Assumes operator always responds correctly. | Tests workload, alarm clarity, time available and training. |
| Common cause | Assumes controls are independent. | Reviews shared utilities, instruments, procedures and people. |
| Action tracking | Recommendations left in report. | Actions assigned, prioritised, verified and reviewed. |
Which major accidents show why scenario analysis matters?
Buncefield and Piper Alpha show why event sequences, escalation paths, barrier dependence and emergency assumptions must be understood before the event.
At Buncefield, a tank overfill developed into a large vapour cloud and major explosion. Scenario analysis is directly relevant because the event path involved transfer, level control, high-level protection, alarm response, overflow, vapour formation, ignition and escalation. The learning is not just 'avoid overfill'; it is to test independent overfill protection, alarm management, operating response, bunding, hazardous area assumptions and leadership assurance.
Piper Alpha shows the importance of escalation analysis and barrier independence. Hydrocarbon release, ignition, emergency shutdown, isolation, communication, permit-to-work weakness, temporary refuge assumptions and emergency response all interacted. A strong scenario analysis asks how one failure could escalate across systems, which barriers are truly independent and what happens if emergency response assumptions are overwhelmed.
| Incident | Analysis lesson | Audit question |
|---|---|---|
| Buncefield | A tank overfill scenario can branch into release, vapour cloud, ignition and escalation if detection and protection fail. | Are overfill barriers independent, tested, understood and reviewed by leaders? |
| Piper Alpha | Escalation can defeat emergency assumptions when isolation, communication and safety critical systems are weak. | Can the site demonstrate independence, testing and command arrangements for escalation scenarios? |
| Offshore emergency shutdown valve learning | Emergency isolation equipment may be safety critical but poorly tested or recorded. | Are safety critical isolation valves tested, maintained and owned with clear performance standards? |
What legal duties make scenario analysis important?
Select the current duty by site nation, dangerous-substance inventory, establishment tier and activity. Great Britain legislation does not automatically govern Northern Ireland.
For qualifying sites, lower-tier operators prepare a major accident prevention policy (MAPP) and implement a safety management system; upper-tier operators have additional safety-report duties. Check the separate GB and NI regimes and the actual inventory before assuming a site’s tier.
| Where | Instrument or rule | Practical boundary |
|---|---|---|
| Great Britain | Control of Major Accident Hazards Regulations 2015 | GB major-accident prevention and mitigation duties for qualifying establishments. |
| Northern Ireland | Control of Major Accident Hazards Regulations (Northern Ireland) 2015 | NI major-accident duties, MAPP, SMS, safety reports and tier boundaries. |
| Great Britain | Health and Safety at Work etc. Act 1974 | GB general work-safety duties |
| Northern Ireland | Health and Safety at Work (Northern Ireland) Order 1978 | NI general work-safety duties |
| Great Britain | Management of Health and Safety at Work Regulations 1999 | GB risk assessment and prevention arrangements |
| Northern Ireland | Management of Health and Safety at Work Regulations (Northern Ireland) 2000 | NI risk assessment and prevention arrangements |
| Great Britain | Dangerous Substances and Explosive Atmospheres Regulations 2002 | GB dangerous-substance fire and explosion risk duties. |
| Northern Ireland | Dangerous Substances and Explosive Atmospheres Regulations (Northern Ireland) 2003 | NI dangerous-substance fire and explosion risk duties. |
COMAH applies only where dangerous-substance thresholds and other scope tests are met; ordinary health and safety duties remain relevant elsewhere. Verify the current tier and site-specific regulator requirements before assigning MAPP or safety-report work.
How should event tree and fault tree findings appear in the risk register?
The risk register should capture the scenario, barriers, dependencies, assumptions and actions rather than only a broad hazard label.
A risk register entry that says 'explosion risk' is too vague to support assurance. It should identify the credible scenario, initiating events, top event, barriers, consequence range, owners, assurance evidence and review triggers.
Where event tree or fault tree analysis changes the understanding of risk, the register should be updated. That includes new common-cause weaknesses, barrier dependencies, action priorities and MOC triggers.
| Field | What to record | Example |
|---|---|---|
| Scenario | Credible event sequence. | Tank overfill leading to vapour cloud explosion. |
| Initiating events | What can start the scenario. | Level control failure or incorrect transfer line-up. |
| Top event | Central unwanted event. | Loss of containment from tank overflow. |
| Barrier set | Preventive, detective, control and mitigative barriers. | High-high trip, operator response, bund, ignition control. |
| Dependencies | Shared systems or common-cause concerns. | Alarm and trip not truly independent. |
| Assurance | Proof that controls are working. | Proof tests, inspections, drills and PSM indicators. |
| Actions | Improvements with owner and deadline. | Install independent overfill protection and revise receipt procedure. |
How could Crownway Fuels Ltd use event trees and fault trees?

Crownway Fuels Ltd could use these methods to turn fuel-storage scenarios into visible barrier decisions and assurance checks.
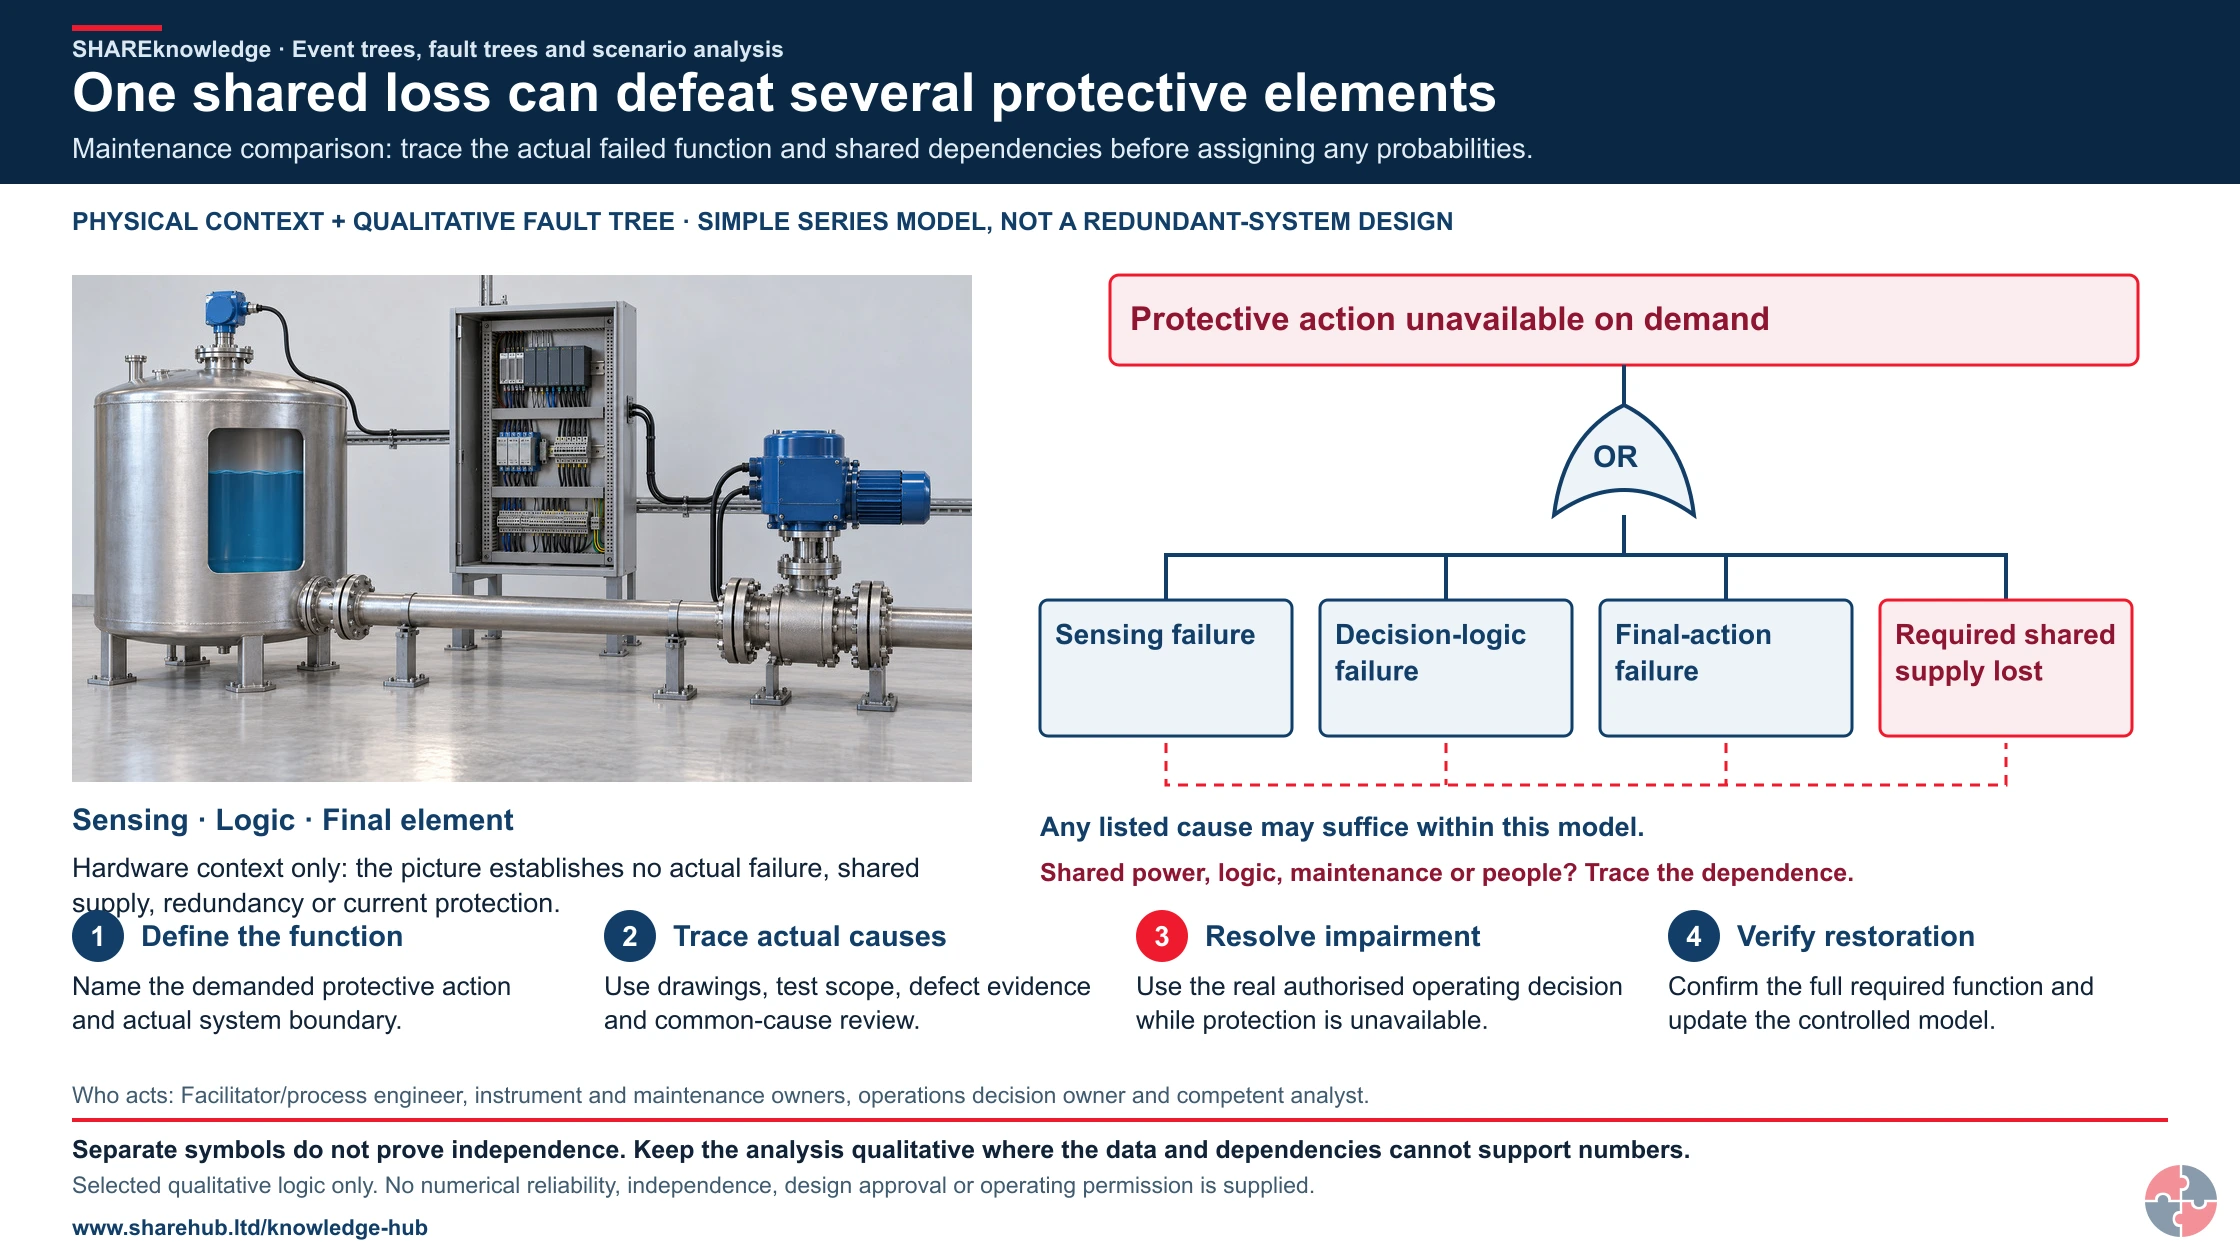
One shared loss can defeat several protective elements
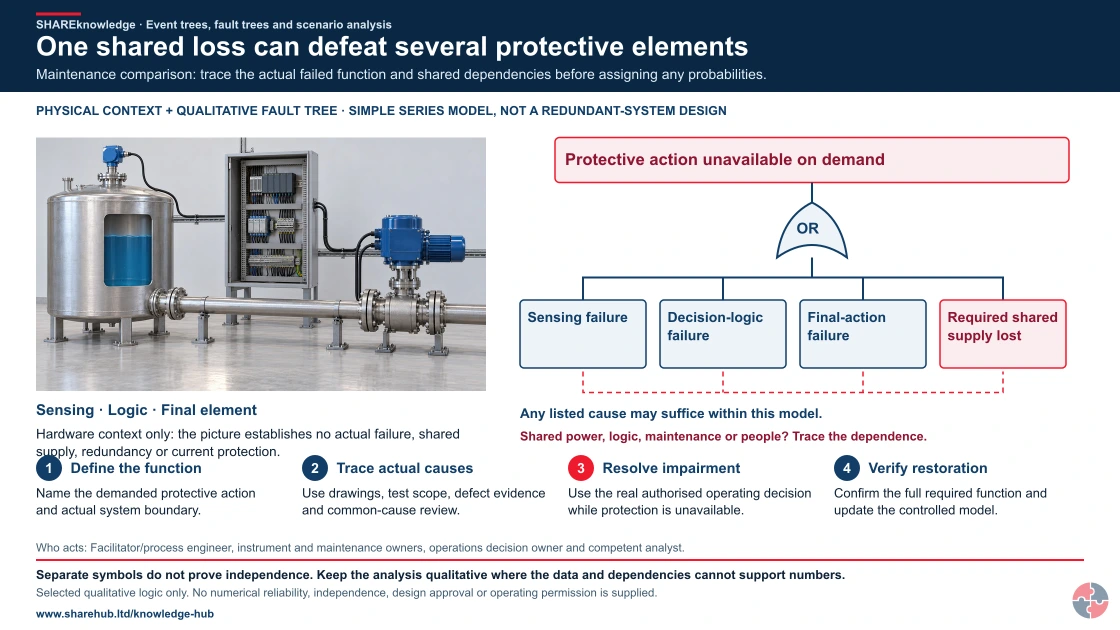
Full written explanation
An exact retained realistic HD hardware source makes the sensing housing/process connection, logic enclosure and actuated final element visible beside a complete native qualitative fault tree. The hardware is context, not a claimed installation, failed device, shared-supply diagram or proof of redundancy. The unchanged logical model places sensing failure, decision-logic failure, final-action failure and loss of a required shared supply beneath an OR gate leading to protective action unavailable on demand. Any listed cause can suffice only within this explicitly simplified series-function model. A distinct dashed red bracket joins the cause leaves as a dependency-review prompt; it is not an independence claim or an additional logic gate. The four original checks define the demanded function, trace actual causes/test scope, resolve impairment through the real operating decision and verify controlled restoration. The full original hold, roles, evidence and cases remain. No failure probability, numerical reliability, SIL, test interval, actual wiring, bypass, restart instruction or operating permission is assigned. The existing HD fault-tree/event-tree pathway and all its source/output files remain exactly unchanged.
Maintenance comparison: trace the actual failed function and shared dependencies before assigning any probabilities.
- Define the function. Name the demanded protective action and actual system boundary.
- Trace actual causes. Use drawings, test scope, defect evidence and common-cause review.
- Resolve impairment. Use the real authorised operating decision while protection is unavailable.
- Verify restoration. Confirm the full required function and update the controlled model.
When the evidence does not fit: Separate symbols do not prove independence. Keep the analysis qualitative where the data and dependencies cannot support numbers.
Who acts: Facilitator/process engineer, instrument and maintenance owners, operations decision owner and competent analyst.
Changed workplace
Tank receipt: Compare backward overfill causes with forward stopping and containment outcomes.
Protective-system maintenance: Trace a failed function and shared dependencies before restoration.
Evidence check: Selected qualitative logic only. No numerical reliability, independence, design approval or operating permission is supplied.
Read the initiating event, top event and conditional branches together
Primary references: HSE Corus investigation: fault-tree method example · HSE LPG safety-report assessment: method context, not a current universal design standard
Open the complete HD image (new tab)Download image
Read the initiating event, top event and conditional branches together
Primary references: HSE Corus investigation: fault-tree method example · HSE LPG safety-report assessment: method context, not a current universal design standard
Crownway Fuels Ltd (worked example). a fuel storage and distribution business with bulk tanks, tanker loading, pipework, pumps, vapour hazards, DSEAR zones, contractors and COMAH-style major accident controls.
Crownway would start with its major accident hazard register. For tank receipt, it would define a credible overfill scenario: product transfer starts, level control fails or a wrong line-up occurs, the tank fills above safe level, overflow occurs, vapour forms, ignition is possible and fire or explosion may escalate to adjacent tanks or loading areas.
The event tree would show the success or failure of level detection, independent high-high protection, operator response, transfer shutdown, bund containment, drainage isolation, vapour dispersion, ignition prevention, fire detection, firefighting and incident command. The fault tree would then test what could cause the top event, such as instrument failure, proof-test failure, bypassed trip, poor procedure, fatigue, unclear alarm priority or MOC failure after tank modification.
Crownway would convert the analysis into practical management controls. Engineering would own independent protection and proof testing. Operations would own transfer procedures and alarm response. Maintenance would own safety critical backlog and impairments. HSSE would own PSM indicators and audit. Leadership would review barrier health, overdue actions, temporary overrides and common-cause risks.
| Management activity | How Crownway would apply it | Evidence produced |
|---|---|---|
| Assess and analyse | Define tank overfill, loading release, pump seal failure, vapour ignition and bund fire scenarios. | Scenario register, event trees, fault trees and bowties. |
| Implement barriers | Set independent overfill protection, alarm response, shutdown, bunding, drainage isolation and ignition controls. | Barrier register and performance standards. |
| Train and authorise | Train operators on scenario sequence, critical alarms, transfer limits and emergency escalation. | Competence records and simulator or drill evidence. |
| Maintain and inspect | Test trips, alarms, valves, bunds, fire systems and hazardous-area equipment. | Proof tests, inspection records and defect close-out. |
| Manage change | Review event trees and fault trees after tank, control-system, procedure, staffing or product changes. | MOC records and pre-start-up safety review. |
| Check and audit | Use first-line checks, PSM audits and specialist reviews to test assumptions. | Audit findings and action tracker. |
| Learn and improve | Review leaks, alarm issues, near misses, Buncefield learning and drill findings. | Leadership review pack and revised barrier standards. |
A decision that changes work
Task, material and setting: A flammable-liquid tank overfill and release scenario at a process site.
People and prerequisites: Operator, engineer, facilitator, analyst and emergency lead; current plant drawings and barrier tests are available.
Before: Define the initiating event, top event and outcomes; identify independent and shared controls.
During: Build the fault tree for release causes and event tree for detection, shutdown, ignition and mitigation outcomes.
Hold or stop: Do not multiply failure probabilities as if independent where barriers share power, software, maintenance or operator action.
Completion and hand back: Assign stronger prevention and mitigation, verify critical changes and update operating and emergency documents.
Evidence: Approved diagrams, assumptions, data provenance, sensitivity and common-cause review, actions and verification records.
How can a fuel-transfer example support event and fault-tree thinking?
Define the event and the control response before arranging scenario branches. The scene supplies no event frequency, failure probability or quantified consequence.
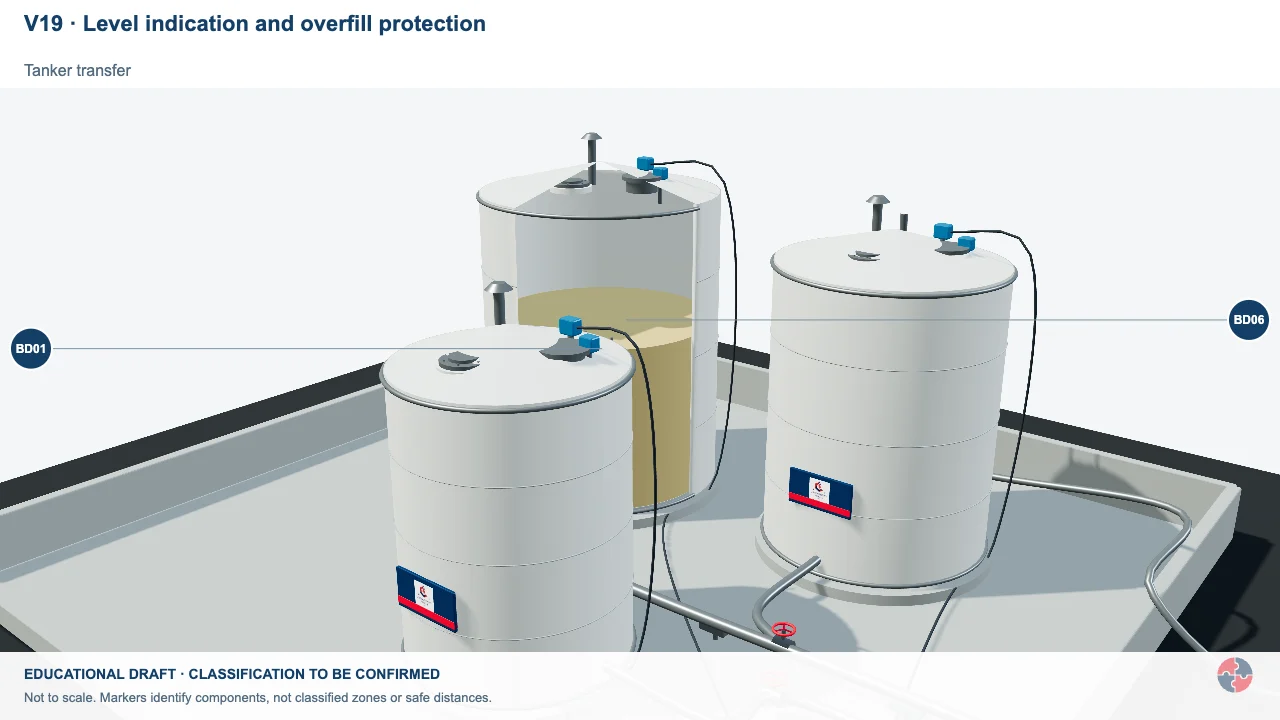
Normal control and independent overfill protection
Compare the normal LT/controller/FCV loop with a separate high-high sensor, safety logic and dedicated inlet ESDV.
Activity focus: Trace the independent sensor-to-action chain and the separate manual ESD input. Red identifies safety duty; blue identifies normal control.
Contextual workplace scene. Use the task, control and evidence checks in this section; appearance alone does not establish safe conditions, individual health or approval.
Educational illustration, not to scale. Coloured zones are teaching examples, not a site-specific hazardous-area classification.
What training helps people use event tree and fault tree analysis?
Training should match role, from awareness of scenario thinking to specialist facilitation and quantitative methods.
General awareness helps operators and supervisors understand why scenario logic matters. They do not need to calculate probabilities, but they do need to know why a high-level alarm, emergency isolation valve, bypass permit or procedure step is safety critical.
Engineers, HSSE advisers and technical authorities need deeper training in building and challenging diagrams, identifying independence, using data cautiously, linking barriers to performance standards and turning findings into actions.
Specialists who lead quantitative or semi-quantitative work need competence in reliability data, logic modelling, uncertainty, human reliability, common-cause failure and ALARP decision-making.
| Role | Learning | Demonstration | Assessor | Record | Reassess when |
|---|---|---|---|---|---|
| Operator | Recognise sequence and stop points | Walk overfill branches | Shift lead | Briefing | Change |
| Facilitator | Set boundary and challenge assumptions | Lead tree review | Technical authority | Study record | New scenario |
| Engineer | Validate gates and safeguards | Trace shared utilities | Engineering lead | Model basis | MOC |
| Analyst | Handle probability and uncertainty | Recalculate sensitivity | Peer reviewer | Calculation | New data |
| Emergency lead | Test escalation timing | Run branch drill | Site lead | Exercise | Plan change |
| Director | Fund critical barrier actions | Trace action to test | Independent assurance | Review record | Weak signal |
How does this topic support NEBOSH PSM study?
This topic supports NEBOSH PSM by helping learners explain event sequences, barrier failure, escalation and improvement actions.
A strong exam answer should not just define event tree or fault tree analysis. It should apply the method to a scenario. Start with the initiating event, identify the top event, explain which barriers should work, describe what happens if they fail and show how the analysis improves controls.
For process safety scenarios, mention loss of containment, fire, explosion, toxic release, overpressure, runaway reaction or escalation. Then connect analysis to safety critical elements, maintenance, competence, MOC, emergency planning and PSM indicators.
| Prompt | What to include | Scenario application |
|---|---|---|
| Define event tree | Forward analysis from initiating event through barrier success or failure. | Tank overfill branches into safe shutdown or vapour cloud. |
| Define fault tree | Backward analysis from top event to combinations of failures. | Loss of containment caused by valve, procedure and maintenance failures. |
| Explain conditional probability | Likelihood of a later event given an earlier event. | Ignition probability after vapour release. |
| Explain common-cause failure | One weakness defeating several barriers. | Shared instrument disables alarm and trip. |
| Improve barriers | Turn analysis into standards, testing and actions. | Add independent protection and proof-test regime. |
| Link to ALARP | Use analysis to justify proportionate risk reduction. | Compare options and evidence for additional safeguards. |
How do management frameworks support this topic?
HSE’s Plan–Do–Check–Act guidance helps assign ownership, deliver controls, check evidence and improve weak arrangements. Apply the relevant legal duties and task-specific technical evidence separately.
Official management guidance: HSE Managing for health and safety (HSG65)
| Framework | Status and scope | Contribution | Limit |
|---|---|---|---|
| HSE HSG65 | GB regulator management guidance | Plan, do, check and act with evidence of current control | Apply to the actual high-consequence scenario. |
What are the warning signs that scenario analysis is not adding value?
Warning signs include generic diagrams, unsupported probabilities, no owners, no action tracking and analysis that is not used by operations.
The biggest warning sign is when the analysis looks clever but nobody on the plant can explain what it changed. A useful analysis should be visible in inspection regimes, proof tests, alarm priorities, procedures, competence, emergency plans and leadership review.
Another warning sign is false reassurance. If teams assume barriers are independent, reliable and always operated correctly without checking evidence, the analysis may hide risk rather than reveal it.
| Warning sign | How it can lead to harm | Response |
|---|---|---|
| Generic scenario wording | Specific escalation paths and barriers are missed. | Rewrite around real plant and operating modes. |
| No operator involvement | Work-as-done is absent from the logic. | Include operators and maintainers in reviews. |
| Unsupported probability data | Risk may appear lower than reality. | Record assumptions and validate locally. |
| Common-cause not reviewed | Several barriers may fail together. | Challenge independence and shared dependencies. |
| No action tracker | Findings do not improve controls. | Assign owners, due dates and verification. |
| Outdated after change | Analysis no longer matches plant or procedures. | Link review to MOC and incident learning. |
| Indicators not linked to barriers | Leaders cannot see barrier degradation. | Create HSG254-style barrier health indicators. |
What do the acronyms and key terms mean?
Acronyms should be defined so readers can follow process safety analysis without assuming prior knowledge.
| Term | Meaning | Why it matters |
|---|---|---|
| ALARP | As low as reasonably practicable. | UK principle for deciding proportionate risk reduction. |
| COMAH | Control of Major Accident Hazards Regulations. | Major hazard legal framework for qualifying establishments. |
| DSEAR | Dangerous Substances and Explosive Atmospheres Regulations. | Fire and explosion assessment duties. |
| ETA | Event tree analysis. | Forward analysis from initiating event to outcomes. |
| FTA | Fault tree analysis. | Backward analysis from top event to causes. |
| HAZOP | Hazard and operability study. | Systematic process deviation review. |
| LOPA | Layers of protection analysis. | Semi-quantitative protection-layer adequacy method. |
| MOC | Management of change. | Ensures changes do not invalidate analysis or barriers. |
| PSM | Process safety management. | Management system for major accident hazards. |
| SCE | Safety critical element. | Equipment, system or structure whose failure could contribute to a major accident. |