SHARE Knowledge Hub
Epidemiology, occupational health data and causal interpretation
Occupational epidemiology compares patterns of exposure and ill health across groups to guide prevention. Incidence, prevalence and relative risk answer different questions; selection bias, confounding, latency and under-reporting can change the apparent pattern. Use population evidence alongside the site’s exposure and surveillance records, protect worker confidentiality and improve controls without claiming that one statistic diagnoses an individual.
Understanding Epidemiology, occupational health data and causal interpretation
Occupational epidemiology compares patterns of exposure and ill health across groups to guide prevention. Incidence, prevalence and relative risk answer different questions; selection bias, confounding, latency and under-reporting can change the apparent pattern. Use population evidence alongside the site’s exposure and surveillance records, protect worker confidentiality and improve controls without claiming that one statistic diagnoses an individual.
Why this matters at work
Where groups have materially different age, sex, job, shift or exposure composition, crude rates can mislead. Stratify by the factor most likely to confound the comparison, or obtain statistical advice on standardisation. For small numbers, show counts and denominators, avoid false precision and use confidence intervals or control charts only with competent interpretation. A statistically non-significant result can still warrant prevention where exposure and consequence are credible. Sources: Morbidity frequency measures; LFS illness definitions and formulae; HSE statistical data sources; Analysing and interpreting data.
Investigate task mix, age or tenure where relevant, exposure, reporting culture, previous conditions, turnover and other possible differences. Small numbers and measurement error can make apparent differences unstable, and adjustment requires suitable analytical competence. Obtain better exposure and case information while controlling credible present hazards. Report the absolute numbers alongside proportions and uncertainty, explain limitations and avoid ranking managers from a single crude rate. A useful decision may be to investigate a task or reporting gap, rather than declaring that the depot caused a particular employee's illness.
How organisations manage this in practice
Use a hierarchy of action. Where data indicates credible current exposure, eliminate or substitute the hazard, reduce amount/time, isolate people through enclosure or automation, use engineering controls, then apply administrative controls and PPE as residual barriers. Health surveillance, monitoring and training are assurance/support measures; they do not interrupt the hazard pathway as reliably as removal or engineering control.
Assess the process and exposure directly: agents, tasks, duration, peaks, routes, control design and performance, changes and comparable exposure groups. Use appropriate occupational-hygiene and healthcare competence. Link anonymised surveillance findings back to control review while retaining clinical confidentiality and necessary individual follow-up. A workplace exposure limit also does not remove the duty to control adequately or define a universal safe/unsafe boundary for every circumstance. Record the purpose, method, results, limitations and actions. Check engineering and organisational barriers through suitable evidence rather than using favourable health data to justify known uncontrolled exposure.
The signed interpretation states association only, limitations, potential confounding, actual control observations and the decision/action owner. Preserve the original extraction, corrections and change reason; do not silently amend last year's definition to make a trend look better. Release only an approved aggregate output after disclosure review. Review the dictionary when tasks, systems, worker coverage or questions change. Sources: Morbidity frequency measures; Measures of association; LFS illness definitions and formulae; HSE statistical data sources; Data protection and workers health information.
Ask what the denominator and missing records allow you to conclude
Teaching data, not a real workforce: period A has 20 newly reported cases during 1,000 person-years of complete follow-up; period B has 30 during 2,000 person-years. The crude rates are 20 and 15 per 1,000 person-years respectively. A claim that risk rose 50% based only on counts ignores the denominator.

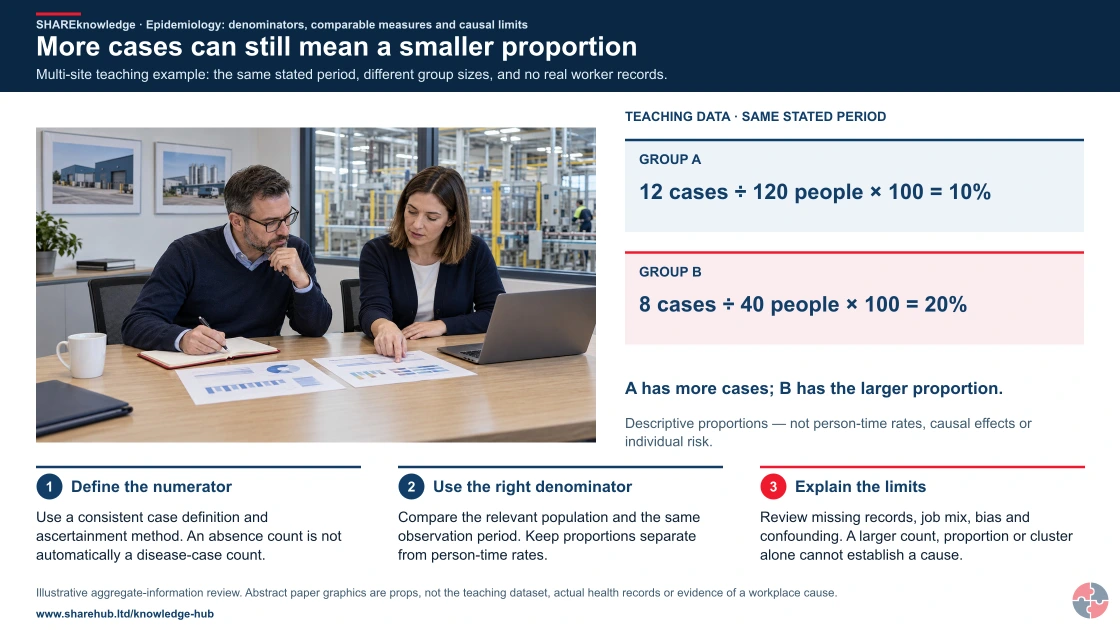
More cases can still mean a smaller proportion
Full written explanation
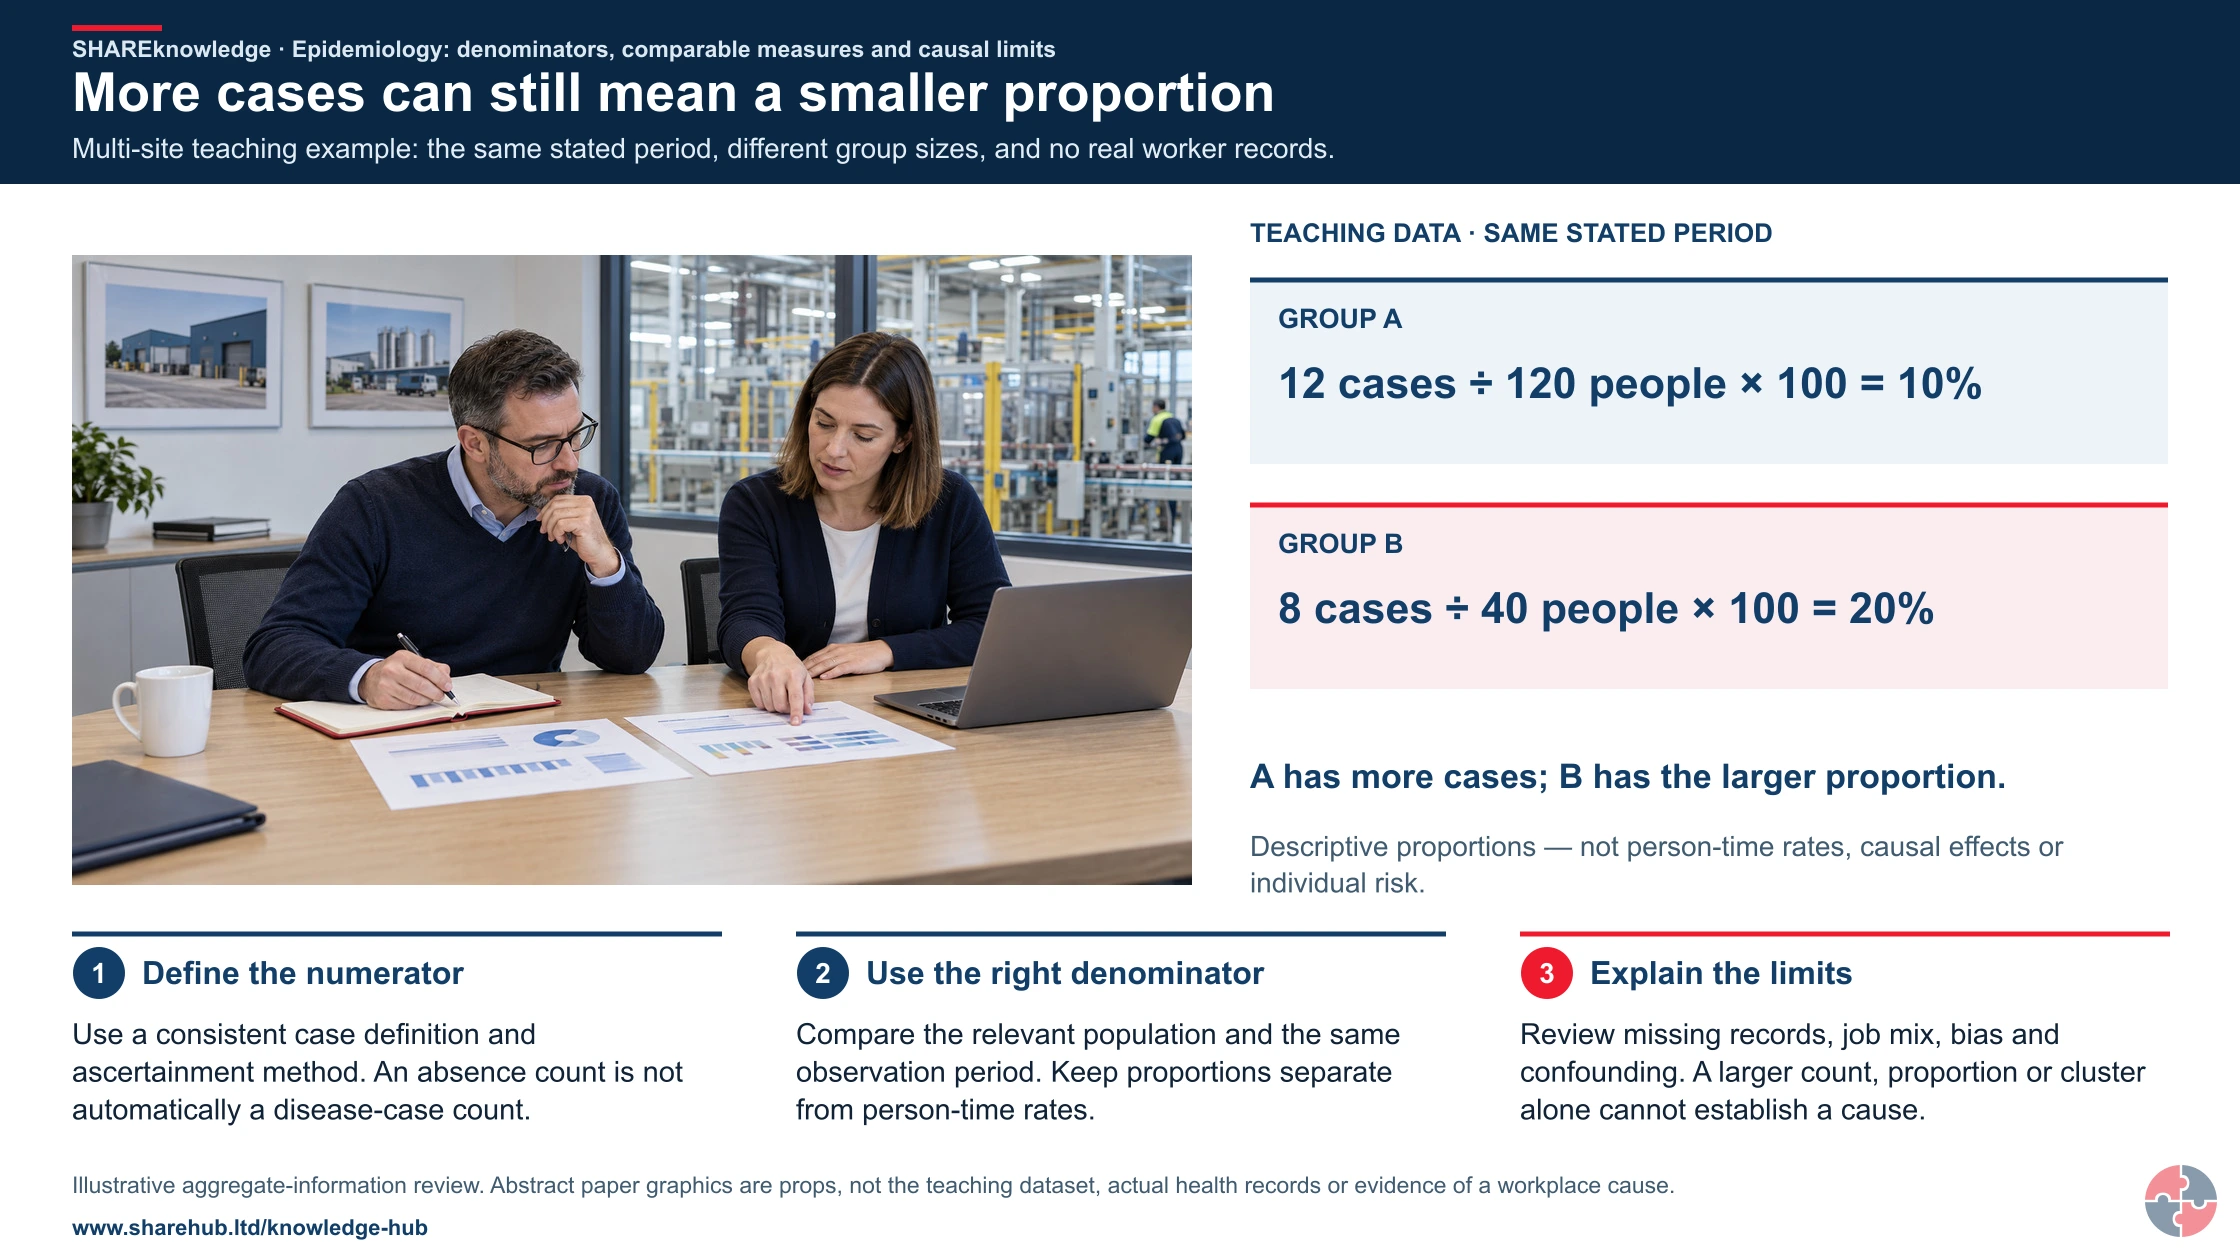
Teaching data for the same stated period: group A has 12 cases among 120 people (12 ÷ 120 × 100 = 10%); group B has 8 among 40 (8 ÷ 40 × 100 = 20%). A has more cases, but B has the larger proportion. These are descriptive proportions, separate from the page’s 20 and 15 per 1,000 person-years example; neither calculation alone establishes causation.
Multi-site teaching example: the same stated period, different group sizes, and no real worker records.
- Define the numerator. Use a consistent case definition and ascertainment method. An absence count is not automatically a disease-case count.
- Use the right denominator. Compare the relevant population and the same observation period. Keep proportions separate from person-time rates.
- Explain the limits. Review missing records, job mix, bias and confounding. A larger count, proportion or cluster alone cannot establish a cause.
Change the pathway
- Only teaching data. No paper or screen contains real employee or health records.
- Different measures stay distinct. The separate 20/15 per 1,000 person-years example is not this proportion comparison.
- No causal clearance. A calculation cannot prove that exposure is harmless or caused an individual illness.
Evidence check: Exact source teaching numbers only. No real worker data, clinical test, fixed small-cell threshold or causal effect is supplied.
Keep counts, proportions, person-time rates and causal claims distinct
Primary references: HSE: interpreting self-reported work-related illness · HSE: act on surveillance results and protect confidentiality
Open the complete HD image (new tab)Download image
Keep counts, proportions, person-time rates and causal claims distinct
Primary references: HSE: interpreting self-reported work-related illness · HSE: act on surveillance results and protect confidentiality
- Choose the measure — Distinguish new cases, existing cases, population and person-time.
- Challenge the comparison — Check workforce change, missingness, reporting and confounding.
- Choose a preventive action — Investigate demonstrated exposure failures without claiming individual causation.
The workforce doubled and its job mix changed; 100 additional records in A and 200 in B have unknown follow-up and outcome, excluded from both complete-record calculations. These rates describe the observed records, not the missing group or a like-for-like exposure effect. The analyst reports missingness and checks job mix and ascertainment before comparing. If extraction has visibly failed, the process owner corrects that exposure gap now, without waiting to prove causation. Use aggregates with privacy review, not an invented small-cell disclosure threshold.
Content amended 19 October 2026 by the SHARE Knowledge Hub editorial team. This records an editorial content change; the existing technical-review and approval status still applies.
Compare rates and study design before explaining a pattern
Group A has 12 cases among 120 people and group B has 8 among 40 over the same stated period: 10% and 20%. The larger case count is not the larger proportion.
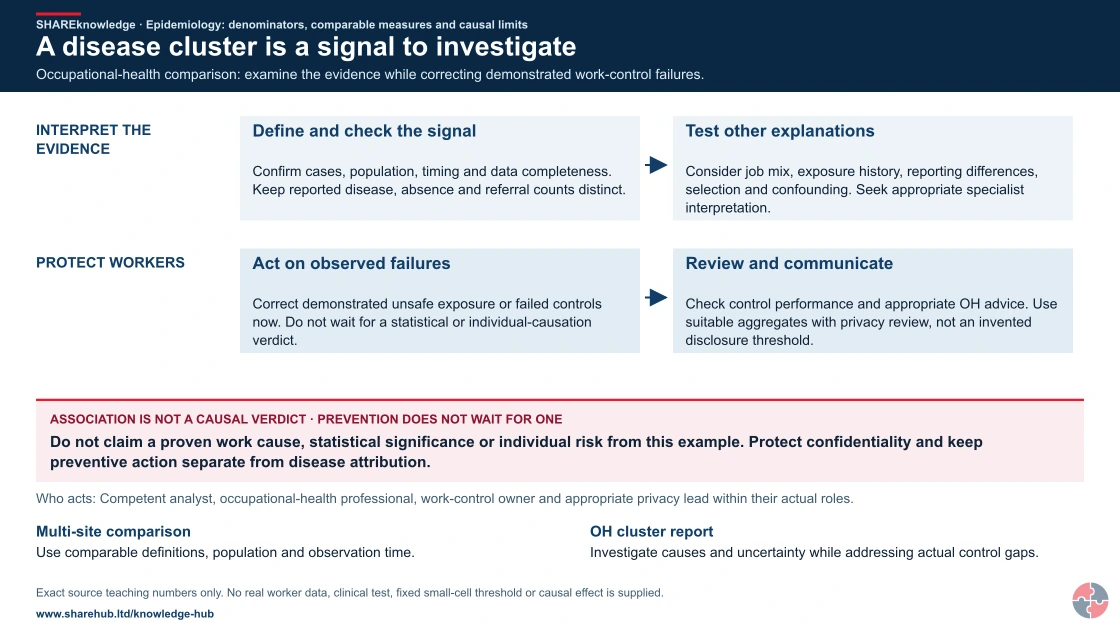
A disease cluster is a signal to investigate
Full written explanation
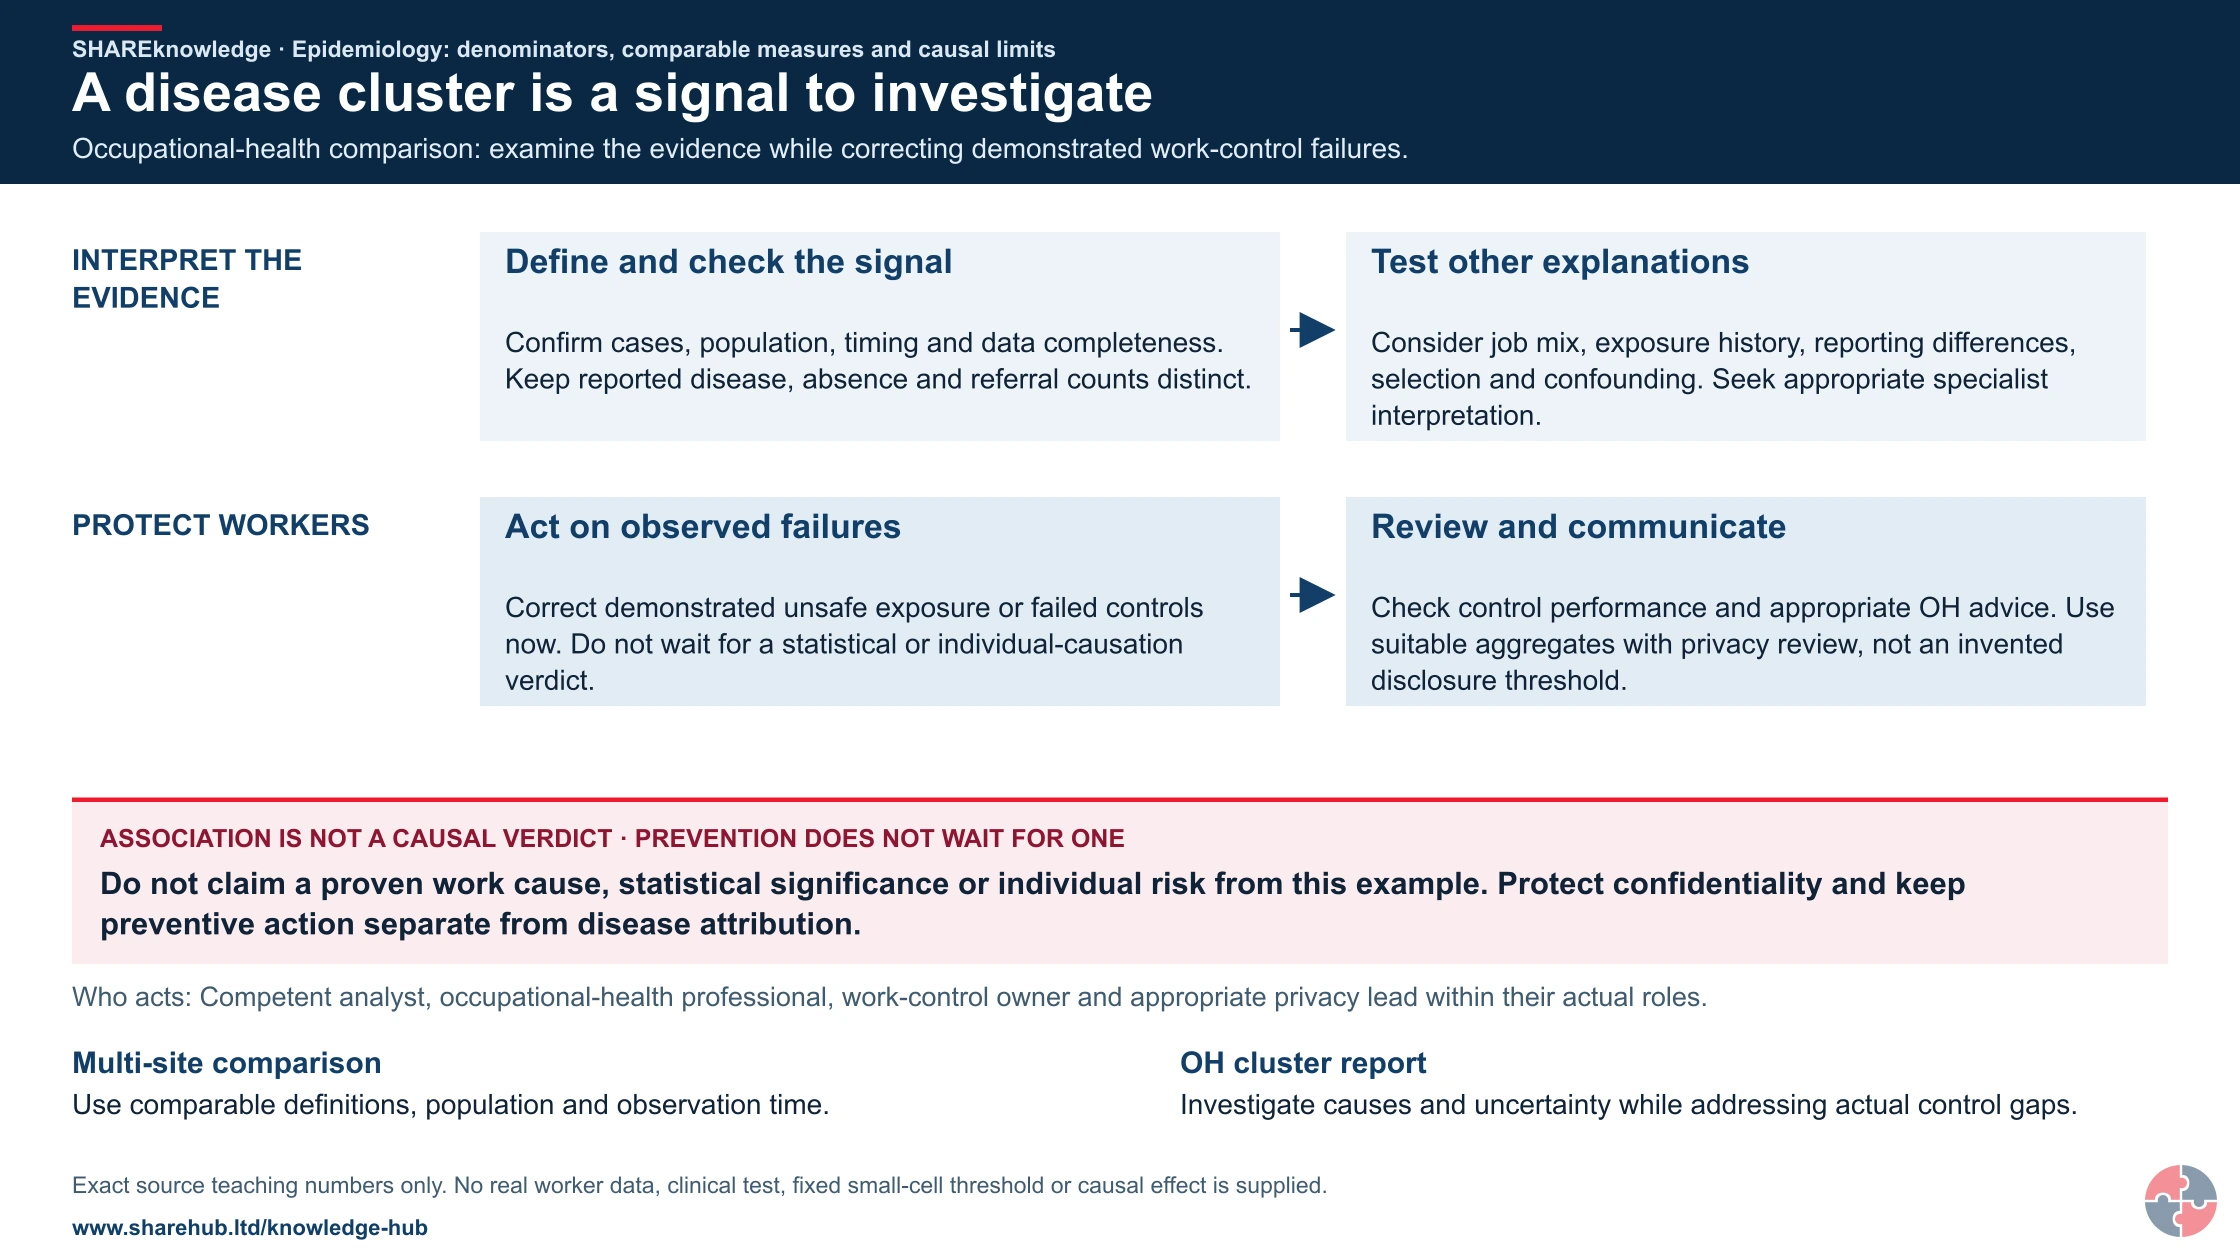
Two parallel lanes keep evidence interpretation separate from practical prevention. The first defines a reported cluster and checks comparison groups, timing, missingness and alternative explanations. The second acts on demonstrated exposure-control failures and reviews the response with competent input. A causal verdict is not a prerequisite for protecting workers; aggregate communication still needs privacy review.
Occupational-health comparison: examine the evidence while correcting demonstrated work-control failures.
- Define and check the signal. Confirm cases, population, timing and data completeness. Keep reported disease, absence and referral counts distinct.
- Test other explanations. Consider job mix, exposure history, reporting differences, selection and confounding. Seek appropriate specialist interpretation.
- Act on observed failures. Correct demonstrated unsafe exposure or failed controls now. Do not wait for a statistical or individual-causation verdict.
- Review and communicate. Check control performance and appropriate OH advice. Use suitable aggregates with privacy review, not an invented disclosure threshold.
When the evidence does not fit: Do not claim a proven work cause, statistical significance or individual risk from this example. Protect confidentiality and keep preventive action separate from disease attribution.
Who acts: Competent analyst, occupational-health professional, work-control owner and appropriate privacy lead within their actual roles.
Changed workplace
Multi-site comparison: Use comparable definitions, population and observation time.
OH cluster report: Investigate causes and uncertainty while addressing actual control gaps.
Evidence check: Exact source teaching numbers only. No real worker data, clinical test, fixed small-cell threshold or causal effect is supplied.
Keep counts, proportions, person-time rates and causal claims distinct
Primary references: HSE: interpreting self-reported work-related illness · HSE: act on surveillance results and protect confidentiality
Open the complete HD image (new tab)Download image
Keep counts, proportions, person-time rates and causal claims distinct
Primary references: HSE: interpreting self-reported work-related illness · HSE: act on surveillance results and protect confidentiality

Make the comparison valid
Check case definitions, population, denominator, time period and uncertainty. Keep these figures separate from real workplace data.
Understand the design
A cohort follows exposure groups for outcomes; a case-control study starts with cases and comparison controls and examines prior exposure. Use the appropriate measure for the design.
Interpret cautiously
Consider confounding, selection/information bias and alternative explanations. Protect privacy, particularly in small groups; association alone does not establish causation.
A simple proportion is not automatically an incidence rate, causal effect or estimate of an individual’s risk.
What is the advice boundary for epidemiology and occupational health data?
This page explains workplace evidence and decision-making, not medical diagnosis, legal advice or statistical consultancy.
What is the advice boundary for epidemiology and occupational health data? — part 1 of 2


Read the complete visual as text
- This page explains workplace evidence and decision-making, not medical…: This page explains workplace evidence and decision-making, not medical diagnosis, legal advice or statistical consultancy.
- Epidemiology can inform risk decisions, but it does not…: Epidemiology can inform risk decisions, but it does not diagnose an individual worker. Diagnosis, treatment, fitness-for-work advice and clinical interpretation should come from qualified healthcare or occupational-health professionals.
What is the advice boundary for epidemiology and occupational health data? — part 2 of 2


Read the complete visual as text
- The workplace role is to use evidence responsibly: identify…: The workplace role is to use evidence responsibly: identify patterns, protect confidentiality, ask better questions, reduce exposure, evaluate controls and seek specialist advice where the evidence is complex or sensitive.
- Worker health information is sensitive. Individual clinical results should…: Worker health information is sensitive. Individual clinical results should not be turned into management dashboards or shared widely. Managers usually need functional advice, trends and control implications, not private medical detail.
Epidemiology can inform risk decisions, but it does not diagnose an individual worker. Diagnosis, treatment, fitness-for-work advice and clinical interpretation should come from qualified healthcare or occupational-health professionals.
The workplace role is to use evidence responsibly: identify patterns, protect confidentiality, ask better questions, reduce exposure, evaluate controls and seek specialist advice where the evidence is complex or sensitive.
Worker health information is sensitive. Individual clinical results should not be turned into management dashboards or shared widely. Managers usually need functional advice, trends and control implications, not private medical detail.
What is the first sound decision from occupational health data?
Define the population, exposure, outcome, time window and data source before comparing rates. Investigate plausible workplace risk and improve control even where individual causation remains uncertain; keep identifiable health information confidential.
A factory sees more respiratory symptoms in one process. The safety lead checks the denominator and reporting method, compares exposure and control records, consults occupational health on confidential findings and improves extraction while testing the pattern. A small cluster is a reason to investigate, not a diagnosis of every worker.
What are the key facts about epidemiology and occupational health data?
The key facts are that health data can reveal patterns, but it must be interpreted with context, limitations and privacy controls.
Rates matter more than raw counts
Ten cases in a small exposed team may mean something very different from ten cases in a large organisation.
New cases and existing cases answer different questions
Incidence helps identify emerging risk; prevalence shows the current burden and support need.
Association is not automatic causation
Bias, confounding, chance and alternative explanations must be considered before claiming cause.
Latency can hide current failure or past exposure
Some occupational diseases appear long after the exposure that caused them.
Health surveillance is control feedback
Surveillance should lead to action on exposure and controls, not just a file note.
Privacy is part of competence
A good adviser protects personal health information while still helping the organisation learn from anonymised trends.
What is epidemiology in occupational health?
Epidemiology in occupational health studies how work-related ill health occurs across groups of workers and how that evidence can guide prevention.
The practical question is not only 'how many people are ill?' It is 'who is affected, what work do they do, what exposures or work factors are present, what has changed, what controls exist, how reliable is the evidence and what action is justified now?'
Occupational health data may come from health surveillance, sickness absence, RIDDOR reports, occupational-health referrals, exposure monitoring, worker surveys, safety observations, compensation data, regulator statistics or specialist research. Each source has value, but each also has limitations.
A mature organisation does not wait for perfect proof. If credible evidence suggests exposure is causing harm, the organisation should review controls, consult workers and reduce risk while it continues to improve the evidence.
| Question | Epidemiological contribution | Workplace decision |
|---|---|---|
| Who is affected? | Identifies distribution by job, site, task, shift, age, sex or exposure group. | Target investigation and controls. |
| How often is it happening? | Uses counts, rates, incidence and prevalence. | Prioritise resources and trend review. |
| What exposure may be linked? | Compares exposed and less-exposed groups. | Review hazard controls and monitoring. |
| When did it happen? | Considers latency, timing and change. | Connect outcomes to past or current work factors. |
| How certain are we? | Considers bias, confounding and data quality. | Decide proportionate action and further evidence needs. |
What types of occupational health data are used?
Occupational health data can be clinical, surveillance-based, self-reported, exposure-based, regulatory, administrative or research-based.
No single data source gives the whole picture. HSE's statistics use sources such as the Labour Force Survey, RIDDOR, THOR, IIDB, death certificates and disease registers because each captures different parts of the risk picture. See HSE statistics data sources and limitations.
Workplace-level data has the same issue. Sickness absence may show burden but not cause. Health surveillance may show early health changes but only in monitored groups. Exposure monitoring may show control quality but not diagnosis. Worker reports may identify weak signals but may be affected by reporting culture.
| Data source | Strength | Limitation |
|---|---|---|
| Health surveillance | Can detect early adverse health change in exposed workers. | Only useful where set up correctly and acted on. |
| Exposure monitoring | Measures airborne, noise, vibration or biological exposure indicators. | Does not by itself prove health outcome. |
| Sickness absence | Shows burden and operational impact. | May not identify work causation. |
| RIDDOR reports | Captures legally reportable diseases and events. | May be affected by under-reporting or reporting thresholds. |
| Worker surveys | Can reveal symptoms, discomfort and concerns. | May be influenced by culture, wording and response bias. |
| National statistics | Shows wider disease patterns and sector trends. | May not match one site's exposure profile. |
| Research studies | Can test associations and risk factors. | Needs careful interpretation before applying locally. |
Which measures should readers understand?
Readers should understand incidence, prevalence, rates, relative risk, odds ratio and attributable patterns because each answers a different question.
The linked HSE incidence and prevalence formulae describe Great Britain Labour Force Survey self-reports of work-related illness over a 12-month reference period. They are not a universal denominator for every workplace dataset.
Raw numbers are easy to misread. A large organisation may have more cases simply because it has more people. A small team may have fewer cases but a much higher rate. The denominator matters. See HSE work-related illness definitions and formulae.
Time also matters. New cases in the last year may point to a recent change or failure. Long-standing cases may show the current health burden, support needs and possible legacy exposure.
| Measure | Plain meaning | Workplace use |
|---|---|---|
| Incidence | New cases in a defined population over a defined period. | Detect emerging health risk after a process, material or work-design change. |
| Prevalence | All existing cases in a defined population at a point or over a period. | Understand total health burden and support need. |
| Rate | Cases adjusted for the size of the population or time at risk. | Compare sites, teams or years more fairly than raw counts. |
| Relative risk | Risk in the exposed group compared with the unexposed group. | Understand whether exposure is associated with higher disease risk. |
| Odds ratio | Odds of exposure among cases compared with controls. | Often used in case-control studies where disease is uncommon. |
| Attributable fraction | Among exposed people, the proportion of cases theoretically attributable to exposure, assuming a causal relationship and a valid comparison group. | Estimate potentially preventable burden only after checking causal inference and study assumptions. |
Method and scope: CDC Field Epidemiology Manual.
How do cohort, case-control and cross-sectional studies differ?
Study designs differ in whether they start with exposure, disease outcome or a single snapshot of both.
Study designs and interpretation — part 1 of 2


Read the complete visual as text
- Cohort study: How it works: Starts with exposed and unexposed groups and follows outcomes over time. Caution: May take a long time; loss to follow-up can bias results.
- Case-control study: How it works: Starts with cases and controls, then compares previous exposure. Caution: Can be affected by recall bias and poor exposure history.
- Cross-sectional study: How it works: Measures exposure and health outcome at one point. Caution: Cannot always establish timing or causation.
Study designs and interpretation — part 2 of 2


Read the complete visual as text
- Ecological study: How it works: Uses group-level data such as regions or industries. Caution: Group associations may not apply to individuals.
- Surveillance data review: How it works: Monitors trends in health checks, reports or absence. Caution: Good for warning signs, but needs context and data-quality checks.
A cohort study starts with exposure status and follows people to see who develops the outcome. It can be powerful for studying cause and timing, but may be expensive and slow, especially for diseases with long latency.
A case-control study starts with people who have the outcome and a comparison group without it, then looks back at exposure. This can be efficient for rare diseases, but is vulnerable to recall bias and exposure misclassification.
A cross-sectional study looks at exposure and health status at one point in time. It is useful for describing patterns and generating hypotheses, but it is weaker for proving which came first.
| Study design | How it works | Caution |
|---|---|---|
| Cohort study | Starts with exposed and unexposed groups and follows outcomes over time. | May take a long time; loss to follow-up can bias results. |
| Case-control study | Starts with cases and controls, then compares previous exposure. | Can be affected by recall bias and poor exposure history. |
| Cross-sectional study | Measures exposure and health outcome at one point. | Cannot always establish timing or causation. |
| Ecological study | Uses group-level data such as regions or industries. | Group associations may not apply to individuals. |
| Surveillance data review | Monitors trends in health checks, reports or absence. | Good for warning signs, but needs context and data-quality checks. |
Method and scope: CDC Field Epidemiology Manual.
How should causation be interpreted without overclaiming?
Causation should be interpreted by combining timing, exposure, biological plausibility, consistency, strength of evidence and alternative explanations.
A safety professional should be careful with language. Saying 'this chemical caused this individual's disease' is a clinical, legal and evidential statement that may be beyond the available data. Saying 'the pattern is consistent with work-related exposure and justifies tighter controls' is often a more defensible workplace conclusion.
Population evidence can be enough to justify prevention even when individual causation cannot be proved. For example, asbestos, silica, wood dust, noise, vibration and some sensitising agents are controlled because their harmful potential is well understood, not because every individual case must be proven first.
| Check | Why it matters | Workplace application |
|---|---|---|
| Temporality | Exposure should come before the health outcome. | Check work history and onset timing. |
| Dose-response | Higher exposure may be linked with higher risk. | Review exposure levels, duration and frequency. |
| Consistency | Similar findings across sources increase confidence. | Compare site data with HSE statistics and research. |
| Plausibility | The mechanism should make biological or ergonomic sense. | Link hazard mechanism to disease pathway. |
| Alternative explanations | Other factors may explain or contribute. | Consider non-work factors without using them to ignore work risk. |
| Control response | Risk reduction should target the credible pathway. | Improve exposure control while evidence is reviewed. |
Method and scope: CDC Field Epidemiology Manual.
How can bias, confounding and uncertainty mislead decisions?
Bias, confounding and uncertainty can make a risk look bigger, smaller or more certain than the evidence supports.
Bias is a systematic error in how data is collected, reported or interpreted. Confounding occurs when another factor is linked to both the exposure and the outcome, making the relationship harder to interpret. Uncertainty is normal; the aim is to make proportionate decisions despite it. See HSE reliability of self-reported work-related illness.
In workplace health, under-reporting is a common problem. Workers may not report symptoms because they think nothing will change, fear consequences, normalise pain or do not connect symptoms to work. That can make a workplace look healthier than it is.
| Problem | How it misleads | Control |
|---|---|---|
| Under-reporting | Makes rates appear lower and delays action. | Build trust, simple reporting and worker consultation. |
| Healthy worker effect | Current workers may look healthier because unwell workers have left. | Consider leavers, absence and job transfer data. |
| Recall bias | People with disease may remember or report exposures differently. | Use records, exposure data and job histories where possible. |
| Confounding | Another factor may explain part of the association. | Consider smoking, age, prior exposure, lifestyle and non-work factors carefully. |
| Small numbers | One or two cases can distort rates in small teams. | Use caution, but still investigate credible clusters. |
| Data silos | OH, HR, safety and operations each see part of the picture. | Create governed, privacy-aware trend review. |
Why does latency matter in occupational disease interpretation?
Latency matters because some occupational diseases appear long after the exposure that contributed to them.
Occupational cancers, asbestos-related disease, some chronic respiratory diseases and noise-induced hearing loss may reflect exposures from years or decades earlier. Current cases therefore do not always prove current controls are poor, but they do show why historical records, exposure control and long-term prevention matter.
Short-latency effects such as irritant dermatitis, some asthma symptoms or acute toxic effects may appear quickly and can be useful early warning signs if investigated promptly.
| Latency pattern | Examples | Interpretation point |
|---|---|---|
| Short latency | Irritation, acute exposure symptoms, some dermatitis flare-ups. | Current task or recent change may be relevant. |
| Medium latency | Some sensitisation patterns, musculoskeletal trends, HAVS progression. | Review exposure history and repeated tasks. |
| Long latency | Asbestos disease, occupational cancers, some chronic lung disease. | Current outcomes may reflect historic exposure. |
| Cumulative burden | Noise, vibration, repeated ergonomic loading or dust exposure. | Dose over time matters, not just one measurement. |
| Delayed recognition | Symptoms normalised until diagnosis or absence. | Encourage early reporting and surveillance where required. |
How should health surveillance and monitoring data be used?
Health surveillance and monitoring data should be used to protect workers, evaluate controls and trigger action.
HSE describes health surveillance as repeated health checks used to identify ill health caused by work. It should be used where workers remain exposed to health risks even after controls are in place and where the conditions make work-related ill health possible and detectable. See HSE health surveillance overview.
Surveillance is not a substitute for control. If results suggest adverse effects or trends, the employer should review exposure, controls, training, maintenance, supervision and whether affected workers need protection from further harm.
| Data point | What it may show | Action |
|---|---|---|
| Individual adverse result | A worker may be showing early health change. | Occupational-health interpretation, exposure review and worker protection. |
| Cluster in one area | A shared exposure or weak control may exist. | Investigate task, exposure and controls. |
| Rising trend over time | Controls may be degrading or work may have changed. | Review maintenance, methods, training and monitoring. |
| Normal results but high exposure | Health change may not yet be detectable. | Reduce exposure rather than waiting for harm. |
| Poor attendance at surveillance | Access, communication or trust may be weak. | Consult workers and improve arrangements. |
| Conflicting exposure and health data | Data quality, timing or individual susceptibility may explain differences. | Seek competent advice and avoid simplistic conclusions. |
How should occupational health data be protected?
Occupational health data should be handled lawfully, transparently, proportionately and with strong confidentiality controls.
Health information is sensitive personal information. Employers need to be clear about what data they collect, why they collect it, who sees it, how long it is kept, what workers are told and how anonymised management information is created. See ICO worker health information guidance.
A useful distinction is between individual clinical information and management information. Managers may need to know whether a worker is fit for a task, what adjustments are recommended or whether controls need review. They usually do not need diagnostic detail or test results.
| Issue | Good practice | Evidence |
|---|---|---|
| Transparency | Explain what health data is collected and why. | Privacy notices and worker information. |
| Need-to-know access | Limit individual information to those who genuinely need it. | Access controls and role definitions. |
| Anonymisation | Use aggregated trends where possible. | Dashboard rules and small-number suppression. |
| Supplier control | Define responsibilities with occupational-health providers. | Contracts and data processing terms. |
| Retention | Keep records for required periods and justified purposes. | Retention schedule and legal register. |
| Worker involvement | Consult on surveillance arrangements and use of data. | Consultation records and feedback. |
How should health data be turned into better workplace decisions?
Health data should be turned into decisions through a clear chain: signal, data quality check, exposure review, control action, communication and review.
The common failure is to collect data and then admire the dashboard. Data only protects people when it changes decisions: redesigning work, improving exposure control, changing tools, fixing ventilation, retraining supervisors, altering health surveillance scope or escalating to leadership.
A good adviser should state what is known, what is uncertain, what action is needed now and what further evidence would improve confidence.
| Decision step | Practical action | Check | Interpretation risk | Hold point |
|---|---|---|---|---|
| Define the decision | Specify who, what exposure, outcome and time window the analysis covers. | Safety lead signs a protocol before viewing data. | Changing the denominator later can manufacture a trend. | Hold a comparison without a stable population. |
| Check sources | Separate self-report, diagnosed surveillance, exposure measures and statutory reports. | Analyst records each source and its missingness. | Sources count different things. | Do not merge them into one case count. |
| Compare rates | Use a suitable denominator and the same case definition and period. | Statistician or competent adviser checks calculation. | Small numbers produce unstable rates. | Do not publish a precise ranking from a tiny cluster. |
| Test alternatives | Consider confounding, selection, reporting and latency. | Review exposure history and alternative explanations. | A confounder can mimic a workplace effect. | Do not claim causation from one association. |
| Protect privacy | Aggregate where possible; limit identifiable data to approved clinical roles. | Privacy lead checks purpose, access and retention. | Small cells can reidentify a worker. | Stop circulation of identifiable results. |
| Control exposure | Review actual controls and improve them when credible risk remains. | Operations tests extraction or work-design change. | Waiting for causal certainty can prolong exposure. | Stop an unsafe process while controls are ineffective. |
| Retest and learn | Repeat the same measures and check whether controls perform. | Leaders review exposure, symptoms and caveats. | Case counts may lag behind a real improvement. | Reopen action when risk or uncertainty remains. |
Illustrative process-health cluster: 6 of 120 exposed workers report symptoms, compared with 2 of 110 in another area. Check case definitions, exposure intensity, participation, time windows and privacy before interpreting the difference; the numbers are invented for teaching.
Which legal duties apply to occupational health data and causation?
Select the duty by site nation and activity. Great Britain instruments do not automatically apply in Northern Ireland.
| Where | Instrument | Practical boundary |
|---|---|---|
| Great Britain | Health and Safety at Work etc. Act 1974 | GB general work-safety duties |
| Northern Ireland | Health and Safety at Work (Northern Ireland) Order 1978 | NI general work-safety duties |
| Great Britain | Management of Health and Safety at Work Regulations 1999 | GB risk assessment and prevention arrangements |
| Northern Ireland | Management of Health and Safety at Work Regulations (Northern Ireland) 2000 | NI risk assessment and prevention arrangements |
| Great Britain | Control of Substances Hazardous to Health Regulations 2002 | GB exposure prevention/control and health surveillance where required. |
| Northern Ireland | Control of Substances Hazardous to Health Regulations (Northern Ireland) 2003 | NI exposure prevention/control and health surveillance where required. |
| Great Britain | Reporting of Injuries, Diseases and Dangerous Occurrences Regulations 2013 | GB reporting of specified occupational diseases and incidents only when criteria are met. |
| Northern Ireland | Reporting of Injuries, Diseases and Dangerous Occurrences Regulations (Northern Ireland) 1997 | NI reporting route for specified occupational diseases and incidents. |
| United Kingdom | UK GDPR | Personal and special-category health data protection |
| United Kingdom | Data Protection Act 2018 | UK data protection framework |
Check the actual work and the current amended instrument; a diagnosis or a statistics table does not by itself establish a reporting or disability-law outcome.
What should be recorded in a health evidence risk register?
A health evidence register should record the health outcome, exposure, data source, limitations, controls, action and review trigger.
This is not the same as a personal medical file. The register should help the organisation learn from trends and control work risk while protecting individual confidentiality.
For high-risk hazards, the register should connect exposure data with health data. A normal health surveillance result should not be used to justify uncontrolled exposure, and a single abnormal result should not be dismissed without checking the work context.
| Field | What to record | Example |
|---|---|---|
| Health outcome | Condition, symptom pattern or surveillance finding. | Increase in dermatitis reports. |
| Exposure group | Task, substance, process, site or role. | Solvent cleaning team. |
| Data source | Surveillance, absence, survey, RIDDOR, exposure monitoring or referral. | Skin checks and COSHH monitoring. |
| Limitations | Under-reporting, small numbers, timing or confounding. | Low survey response and recent product change. |
| Current controls | Engineering, procedural, PPE, training and surveillance controls. | LEV, gloves, substitution review and skin checks. |
| Action | Exposure reduction, investigation, training or specialist review. | Replace product and retrain on glove selection. |
| Review trigger | New cases, exposure exceedance, audit defect or process change. | Review after three months and after new product trial. |
How could Crownway Fuels Ltd use occupational health data responsibly?

Crownway Fuels Ltd could use occupational health data by connecting exposure monitoring, health surveillance, anonymised trends and control actions.
A field decision from start to hand-back — part 1 of 3


Read the complete visual as text
- 1. Task and setting: Investigate a respiratory-symptom cluster in a factory process.
- 2. People and prerequisites: Safety lead, occupational health, analyst, privacy lead and operators; agree who may see identifiable records.
- 3. Before the task: Define case, denominator, exposure, time window, data source and approved data access.
A field decision from start to hand-back — part 2 of 3


Read the complete visual as text
- 1. Check during work: Compare like with like, inspect exposure and extraction, test confounding and reporting bias, and act on a plausible control gap.
- 2. Stop, hold or refer: Do not diagnose an individual or circulate small-cell identities; pause an unsafe process when controls fail.
A field decision from start to hand-back — part 3 of 3


Read the complete visual as text
- 1. Completion and hand-back: Give operations an exposure-control action, statistical caveat and retest date, and revisit after process or testing changes.
- 2. Retained evidence: Analysis protocol, aggregated counts, source limitations, exposure checks, privacy decision and control verification.
Crownway Fuels Ltd (worked example). a fuel storage and distribution business with hazardous substances, tanker loading, maintenance work, contractors, DSEAR areas, noisy plant, manual handling, shift work and safety-critical operations.
Crownway would maintain a health risk profile covering benzene and hydrocarbon exposure, skin contact, noise, vibration from tools, diesel exhaust, manual handling and stress or fatigue indicators. Each health risk would be linked to exposure controls, monitoring arrangements, surveillance triggers, legal duties and action owners.
Individual health surveillance results would be handled through occupational health with clear confidentiality. Managers would receive functional advice and anonymised trend information where appropriate, not private clinical detail. If trends show a rise in skin irritation in loading operators, the business would review glove selection, splash controls, hygiene, SDS information, product changes, supervision and training rather than simply blaming individual behaviour.
The leadership team would review health data alongside exposure monitoring, incident reports, near misses, audit findings, maintenance defects and worker feedback. The aim would be prevention: reduce exposure, improve controls and learn from weak signals before occupational disease becomes normalised.
| Management element | How Crownway would apply it | Evidence produced |
|---|---|---|
| Assess and analyse | Maintain a health risk profile linking exposure groups to substances, noise, vibration, manual handling and wellbeing risks. | Health risk register and exposure group map. |
| Collect data | Use health surveillance, exposure monitoring, worker reports, RIDDOR checks, absence themes and audit findings. | Governed dataset and source register. |
| Protect privacy | Separate individual clinical information from anonymised management trends. | OH contract, privacy notice and access controls. |
| Interpret | Review trends for latency, confounding, under-reporting, changes in process and data limitations. | Quarterly health evidence review. |
| Act | Trigger exposure reduction, maintenance, training, PPE review, substitution or task redesign. | Action tracker and verified close-out. |
| Assure | Audit whether controls and surveillance actions have been implemented. | Second-line HSSE audit and leadership minutes. |
| Improve | Use trends and lessons to update risk assessments, procurement, contractor rules and training. | Revised standards and briefing records. |
A field decision from start to hand-back
Task, material and setting: Investigate a respiratory-symptom cluster in a factory process.
People and prerequisites: Safety lead, occupational health, analyst, privacy lead and operators; agree who may see identifiable records.
Before: Define case, denominator, exposure, time window, data source and approved data access.
During: Compare like with like, inspect exposure and extraction, test confounding and reporting bias, and act on a plausible control gap.
Hold or stop: Do not diagnose an individual or circulate small-cell identities; pause an unsafe process when controls fail.
Completion and hand back: Give operations an exposure-control action, statistical caveat and retest date, and revisit after process or testing changes.
Evidence: Analysis protocol, aggregated counts, source limitations, exposure checks, privacy decision and control verification.
What training helps people use occupational health data well?
Training should build from basic health-risk awareness to specialist interpretation and privacy-aware decision-making.
All managers who receive health trend information should understand the limits of the data. They do not need to become epidemiologists, but they do need to know that raw numbers can mislead, health surveillance needs action and confidential information must be protected.
Diploma-level learners and specialists need deeper understanding of study design, rates, bias, confounding, latency, exposure grouping, statistical uncertainty and communication of evidence.
| Role | Learning | Demonstration | Assessor | Record | Reassess when |
|---|---|---|---|---|---|
| Workers | Understand reporting and confidentiality | Locate safe concern route | Occupational-health lead | Induction | Route change |
| Supervisors | Recognise clusters without diagnosis | Escalate a process pattern | Safety lead | Concern log | New trend |
| Safety advisers | Connect exposure and control data | Recheck denominator and missing data | Competent lead | Analysis note | Method change |
| Occupational health | Interpret clinical trends privately | Advise on aggregated action | Clinical lead | Confidential record | New findings |
| Privacy leads | Control access, purpose and retention | Audit aggregate output | DPO | Data decision | New use |
| Directors | Resource prevention under uncertainty | Review control action and effect | Independent lead | Board review | Persistent cluster |
How does this topic support NEBOSH Diploma DN2 10.6?
This topic directly supports DN2 10.6 by requiring learners to analyse epidemiology, occupational health data and causal interpretation.
A strong Diploma answer should explain what the data shows, what it does not show, how reliable it is, what further information is needed and what action is justified. It should not simply define incidence and prevalence.
For scenario-based assessment, the learner should connect statistics to workplace reality: exposure groups, latency, bias, under-reporting, worker consultation, health surveillance, legal duties, privacy and proportionate control action.
| Requirement | What to explain | Scenario application |
|---|---|---|
| Epidemiology | How health outcomes are distributed in populations. | Compare disease patterns by job, site or exposure group. |
| Incidence and prevalence | New cases versus total burden. | Distinguish emerging risk from ongoing support need. |
| Relative risk and odds ratio | How risk differs between exposed and comparison groups. | Interpret whether exposure appears associated with outcome. |
| Cohort and case-control logic | Different routes for studying exposure and disease. | Explain strengths and weaknesses of available evidence. |
| Latency | Delay between exposure and disease. | Avoid assuming current disease always reflects current controls. |
| Bias and confounding | How data can mislead. | Identify under-reporting, healthy worker effect or smoking as possible confounders. |
| Ethical data use | Confidentiality and proportionality. | Use anonymised trends and protect individual health information. |
How can management arrangements support this topic?
The voluntary standard can structure ownership and review; it is not itself a legal duty or proof that this work is controlled.
Official management guidance: HSE Managing for health and safety (HSG65)
What are the warning signs that health data is being misused or ignored?
Warning signs include dashboard-only management, poor privacy, under-reporting, weak trend review and failure to act on surveillance findings.
Health data misuse can harm trust quickly. Workers may stop reporting symptoms if they believe information will be used against them. Managers may make poor decisions if they treat raw counts as proof, ignore latency or fail to separate individual diagnosis from population risk.
The strongest warning sign is when health surveillance, exposure monitoring or absence trends show a problem but the organisation cannot point to any control change.
| Warning sign | How it causes harm | Improvement action |
|---|---|---|
| Raw counts compared without denominators | Small sites, large sites and exposure groups are misread. | Use rates and define the population at risk. |
| No action after abnormal surveillance results | Exposure continues and workers may suffer further harm. | Review controls and occupational-health advice. |
| Individual health details shared widely | Trust is damaged and data protection risk increases. | Restrict access and use functional advice. |
| Under-reporting culture | Risks appear lower than reality. | Improve worker consultation and no-blame reporting. |
| Latency ignored | Past exposure and current controls are confused. | Review exposure history and long-term disease pathways. |
| Confounding ignored | False conclusions drive poor action. | Consider alternative explanations and seek competent advice. |
| Dashboard without review | Data exists but decisions do not change. | Create action owners and leadership review. |
How can the hierarchy of controls reduce powder exposure while investigating a workplace health pattern?
How can the ERICPD hierarchy of controls reduce powder exposure while investigating a workplace health pattern?

| Control level | Control for this activity | Owner and verification | Stop / restart decision |
|---|---|---|---|
| Eliminate | Remove or suspend the changed powder process where feasible and restore a suitable assessed alternative. | Task owner verifies that the proposed change removes the named hazardous step, including foreseeable cleaning, maintenance and work transferred elsewhere. | If the hazardous step remains, keep it within the task assessment and select the stronger feasible remaining controls. |
| Reduce, including substitution | Trial a suitable lower-hazard formulation or non-dusty form after reviewing respiratory, skin, fire and product-quality risks. | Competent task/process owner validates suitability, compatibility and new hazards against the actual operating requirements before the alternative is adopted. | Reject an alternative if its performance is unproved or its new hazards are unresolved. |
| Isolate | Separate the affected process from nearby workers and prevent contaminated dust spreading through the workplace. | Supervisor checks the actual boundary, affected people and connected work; verify separation or isolation before allowing access. | Hold or stop for failed capture, unresolved material hazards or continuing symptoms requiring investigation. |
| Control: physical safeguards | Verify enclosure, extraction and cleaning against the actual new material and rate of use. | Competent equipment/process owner checks old/new material identity, actual exposure, capture performance and change approval. | Hold or stop for failed capture, unresolved material hazards or continuing symptoms requiring investigation. |
| Control: work method and response | Investigate the change and exposure route, involve workers and occupational health, and agree evidence needed before restarting. | Supervisor confirms the work limits, competent cover, communication and stop/restart authority with the people doing this activity. | Hold work when the agreed limits, competent cover or effective communication cannot be maintained. |
| PPE | Select adequate suitable RPE and other protection for remaining exposure; PPE does not replace fixing failed source control. | Assessor confirms whether personal protection is needed and checks suitability, condition, compatibility and any required fit evidence. | Do not use unsuitable protection or rely on PPE to continue after an essential source control fails. |
| Discipline | Check corrective action in normal work, review further health reports and retain the authorised restart evidence. | Release only after process owner accepts verified controls with occupational-health input as appropriate. Retain verification and unresolved restrictions at handover. | Keep the task on hold until required reinstatement evidence and unresolved defects are accepted by the responsible owner. |
How can the ISO 45001 hierarchy of controls reduce powder exposure while investigating a workplace health pattern?

| Control level | Control for this activity | Owner and verification | Stop / restart decision |
|---|---|---|---|
| Elimination | Remove or suspend the changed powder process where feasible and restore a suitable assessed alternative. | Task owner verifies that the proposed change removes the named hazardous step, including foreseeable cleaning, maintenance and work transferred elsewhere. | If the hazardous step remains, keep it within the task assessment and select the stronger feasible remaining controls. |
| Substitution | Trial a suitable lower-hazard formulation or non-dusty form after reviewing respiratory, skin, fire and product-quality risks. | Competent task/process owner validates suitability, compatibility and new hazards against the actual operating requirements before the alternative is adopted. | Reject an alternative if its performance is unproved or its new hazards are unresolved. |
| Engineering controls | Separate the affected process from nearby workers and prevent contaminated dust spreading through the workplace. | Supervisor checks the actual boundary, affected people and connected work; verify separation or isolation before allowing access. | Hold or stop for failed capture, unresolved material hazards or continuing symptoms requiring investigation. |
| Engineering controls | Verify enclosure, extraction and cleaning against the actual new material and rate of use. | Competent equipment/process owner checks old/new material identity, actual exposure, capture performance and change approval. | Hold or stop for failed capture, unresolved material hazards or continuing symptoms requiring investigation. |
| Administrative controls | Investigate the change and exposure route, involve workers and occupational health, and agree evidence needed before restarting. | Supervisor confirms the work limits, competent cover, communication and stop/restart authority with the people doing this activity. | Hold work when the agreed limits, competent cover or effective communication cannot be maintained. |
| PPE | Select adequate suitable RPE and other protection for remaining exposure; PPE does not replace fixing failed source control. | Assessor confirms whether personal protection is needed and checks suitability, condition, compatibility and any required fit evidence. | Do not use unsuitable protection or rely on PPE to continue after an essential source control fails. |
| Administrative controls | Check corrective action in normal work, review further health reports and retain the authorised restart evidence. | Release only after process owner accepts verified controls with occupational-health input as appropriate. Retain verification and unresolved restrictions at handover. | Keep the task on hold until required reinstatement evidence and unresolved defects are accepted by the responsible owner. |
What do the acronyms and key terms mean?
Acronyms and statistical terms should be explained because occupational health data is often misread when language is unclear.
| Term | Full expansion | Meaning here |
|---|---|---|
| Attributable fraction | Attributable fraction | Estimated proportion of cases that can be attributed to a risk factor in a defined population. |
| Case-control study | Case-control study | Study that starts with cases and controls, then looks back at exposure history. |
| Cohort study | Cohort study | Study that starts with exposure groups and follows outcomes over time. |
| Confounding | Confounding | Distortion caused by another factor linked to both exposure and outcome. |
| COSHH | Control of Substances Hazardous to Health | Control of Substances Hazardous to Health. |
| EH40 | EH40 | HSE publication containing workplace exposure limits. |
| IIDB | Industrial Injuries Disablement Benefit | Industrial Injuries Disablement Benefit. |
| Incidence | Incidence | New cases in a defined population over a defined period. |
| Latency | Latency | Delay between exposure and development or recognition of disease. |
| LFS | Labour Force Survey | Labour Force Survey. |
| OH | Occupational health | Occupational Health. |
| Prevalence | Prevalence | Total existing cases in a defined population. |
| Relative risk | Relative risk | Risk in an exposed group compared with a comparison group. |
| RIDDOR | Reporting of Injuries, Diseases and Dangerous Occurrences Regulations | Reporting of Injuries, Diseases and Dangerous Occurrences Regulations. |
| THOR | The Health and Occupation Research network | The Health and Occupation Reporting network. |